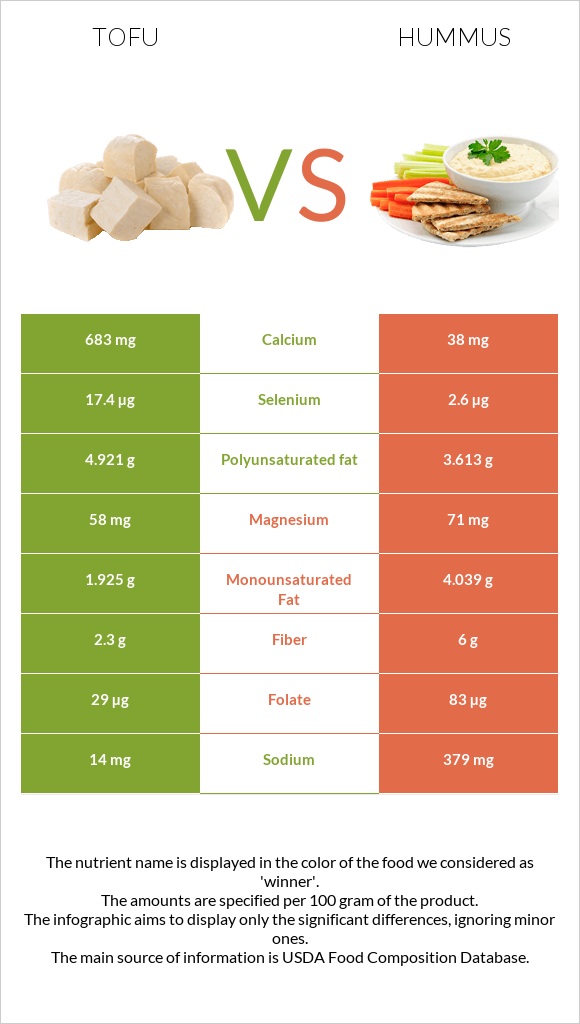
The main differences between tofu and hummus Tofu is richer in calcium, selenium, manganese, and polyunsaturated fat, yet hummus is richer in copper, fiber, folate, and vitamin B6. Daily need coverage for calcium for tofu is 65% higher. Tofu contains 7 times more selenium than hummus. Tofu contains 17.4µg of selenium, while hummus contains 2.6µg. Tofu contains less sodium. Food types used in this article are Tofu, raw, firm, prepared with calcium sulfate and Hummus, commercial .
Infographic
Mineral Comparison
Mineral comparison score is based on the number of minerals by which one or the other food is richer. The "coverage" charts below show how much of the daily needs can be covered by 300 grams of the food.
4
100 g
300 g
0.25 block - 81g 0.5 cup - 126g
Magnesium
Magnesium
Calcium
Calcium
Potassium
Potassium
Iron
Iron
Copper
Copper
Zinc
Zinc
Phosphorus
Phosphorus
Sodium
Sodium
Manganese
Manganese
Selenium
Selenium
41%
205%
21%
100%
126%
43%
81%
1.8%
154%
95%
3
100 g
300 g
1 tbsp - 15g 1 cup - 246g
Magnesium
Magnesium
Calcium
Calcium
Potassium
Potassium
Iron
Iron
Copper
Copper
Zinc
Zinc
Phosphorus
Phosphorus
Sodium
Sodium
Manganese
Manganese
Selenium
Selenium
51%
11%
20%
92%
176%
50%
75%
49%
101%
14%
Vitamin Comparison
Vitamin comparison score is based on the number of vitamins by which one or the other food is richer. The "coverage" charts below show how much of the daily needs can be covered by 300 grams of the food.
2
100 g
300 g
0.25 block - 81g 0.5 cup - 126g
Vitamin C
Vit. C
Vitamin D
Vit. D
Vitamin A
Vit. A
Vitamin E
Vit. E
Vitamin B1
Vit. B1
Vitamin B2
Vit. B2
Vitamin B3
Vit. B3
Vitamin B5
Vit. B5
Vitamin B6
Vit. B6
Vitamin B12
Vit. B12
Vitamin K
Vit. K
Folate
Folate
0.67%
0%
0%
0%
40%
24%
7.1%
8%
21%
0%
0%
22%
4
100 g
300 g
1 tbsp - 15g 1 cup - 246g
Vitamin C
Vit. C
Vitamin D
Vit. D
Vitamin A
Vit. A
Vitamin E
Vit. E
Vitamin B1
Vit. B1
Vitamin B2
Vit. B2
Vitamin B3
Vit. B3
Vitamin B5
Vit. B5
Vitamin B6
Vit. B6
Vitamin B12
Vit. B12
Vitamin K
Vit. K
Folate
Folate
0%
0%
0%
0%
45%
15%
11%
7.9%
46%
0%
0%
62%
All nutrients comparison - raw data values
Nutrient
DV% diff.
Calcium
683mg
38mg
65%
Selenium
17.4µg
2.6µg
27%
Protein
17.27g
7.9g
19%
Manganese
1.181mg
0.773mg
18%
Copper
0.378mg
0.527mg
17%
Sodium
14mg
379mg
16%
Fiber
2.3g
6g
15%
Folate
29µg
83µg
14%
Polyunsaturated fat
4.921g
3.613g
9%
Vitamin B6
0.092mg
0.2mg
8%
Monounsaturated fat
1.925g
4.039g
5%
Carbs
2.78g
14.29g
4%
Magnesium
58mg
71mg
3%
Iron
2.66mg
2.44mg
3%
Vitamin B2
0.102mg
0.064mg
3%
Zinc
1.57mg
1.83mg
2%
Phosphorus
190mg
176mg
2%
Vitamin B1
0.158mg
0.18mg
2%
Calories
144kcal
166kcal
1%
Fats
8.72g
9.6g
1%
Vitamin B3
0.381mg
0.582mg
1%
Saturated fat
1.261g
1.437g
1%
Protein per 100 calories
12g
4.8g
N/A
Calories per 10 g protein
83kcal
210kcal
N/A
Weight per 100 calories
69g
60g
N/A
Unsaturated / Saturated Fat ratio
5.4
5.3
N/A
Vitamin C
0.2mg
0mg
0%
Net carbs
0.48g
8.29g
N/A
Potassium
237mg
228mg
0%
Vitamin B5
0.133mg
0.132mg
0%
Tryptophan
0.235mg
0%
Threonine
0.785mg
0%
Isoleucine
0.849mg
0%
Leucine
1.392mg
0%
Lysine
0.883mg
0%
Methionine
0.211mg
0%
Phenylalanine
0.835mg
0%
Valine
0.87mg
0%
Histidine
0.431mg
0%
Macronutrient Comparison
Macronutrient breakdown side-by-side comparison
2
17%
9%
3%
70%
Protein:
17.27 g
Fats:
8.72 g
Carbs:
2.78 g
Water:
69.83 g
Other:
1.4 g
3
8%
10%
14%
67%
Protein:
7.9 g
Fats:
9.6 g
Carbs:
14.29 g
Water:
66.59 g
Other:
1.62 g
Contains
more
Protein Protein
+118.6%
Contains
more
Fats Fats
+10.1%
Contains
more
Carbs Carbs
+414%
Contains
more
Other Other
+15.7%
Fat Type Comparison
Fat type breakdown side-by-side comparison
2
16%
24%
61%
Saturated fat:
Sat. Fat
1.261 g
Monounsaturated fat:
Mono. Fat
1.925 g
Polyunsaturated fat:
Poly. Fat
4.921 g
1
16%
44%
40%
Saturated fat:
Sat. Fat
1.437 g
Monounsaturated fat:
Mono. Fat
4.039 g
Polyunsaturated fat:
Poly. Fat
3.613 g
Contains
less
Sat. Fat Saturated fat
-12.2%
Contains
more
Poly. Fat Polyunsaturated fat
+36.2%
Contains
more
Mono. Fat Monounsaturated fat
+109.8%