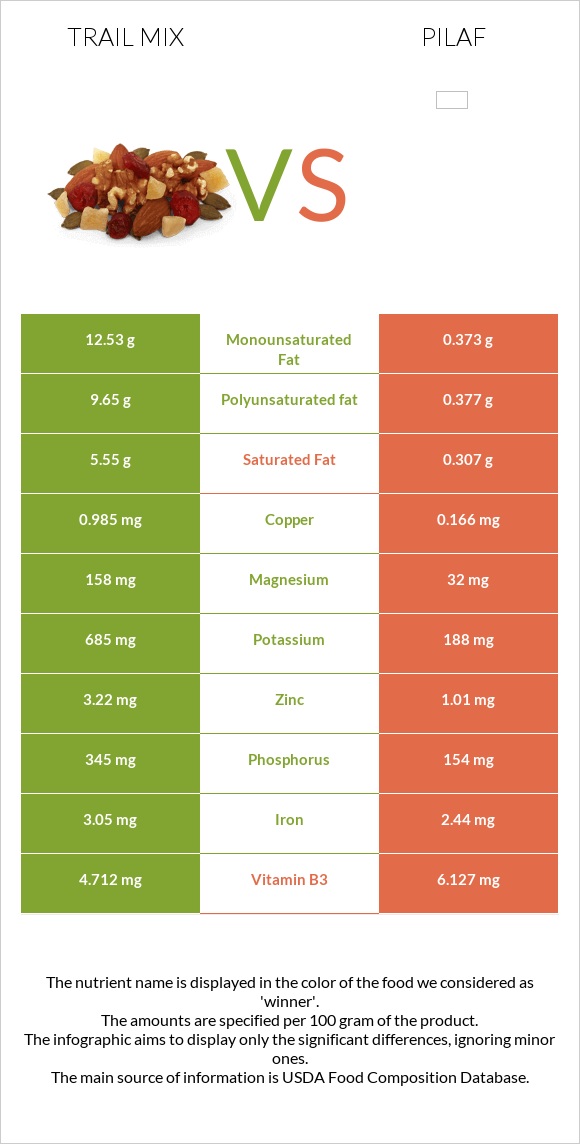
Differences between trail mix and pilaf Trail mix has more copper, magnesium, phosphorus, zinc, and potassium, while pilaf has more folate, vitamin B1, and vitamin B3. Trail mix's daily need coverage for copper is 91% higher. Pilaf contains 18 times less saturated fat than trail mix. Trail mix contains 5.55g of saturated fat, while pilaf contains 0.307g. Trail mix has a lower glycemic index. The glycemic index of trail mix is 15, while the glycemic index of pilaf is 60. The food types used in this comparison are Snacks, trail mix, regular and Rice and vermicelli mix, rice pilaf flavor, unprepared .
Infographic
Mineral Comparison
Mineral comparison score is based on the number of minerals by which one or the other food is richer. The "coverage" charts below show how much of the daily needs can be covered by 300 grams of the food.
8
100 g
300 g
1 oz - 28.35g 1.5 oz - 42g 1 cup - 150g
Magnesium
Magnesium
Calcium
Calcium
Potassium
Potassium
Iron
Iron
Copper
Copper
Zinc
Zinc
Phosphorus
Phosphorus
Sodium
Sodium
Manganese
Manganese
Selenium
Selenium
113%
23%
60%
114%
328%
88%
148%
30%
135%
0%
1
100 g
300 g
1 tbsp - 9.6g 0.333 cup - 68g
Magnesium
Magnesium
Calcium
Calcium
Potassium
Potassium
Iron
Iron
Copper
Copper
Zinc
Zinc
Phosphorus
Phosphorus
Sodium
Sodium
Manganese
Manganese
Selenium
Selenium
23%
25%
17%
92%
55%
28%
66%
170%
115%
177%
Vitamin Comparison
Vitamin comparison score is based on the number of vitamins by which one or the other food is richer. The "coverage" charts below show how much of the daily needs can be covered by 300 grams of the food.
2
100 g
300 g
1 oz - 28.35g 1.5 oz - 42g 1 cup - 150g
Vitamin C
Vit. C
Vitamin D
Vit. D
Vitamin A
Vit. A
Vitamin E
Vit. E
Vitamin B1
Vit. B1
Vitamin B2
Vit. B2
Vitamin B3
Vit. B3
Vitamin B5
Vit. B5
Vitamin B6
Vit. B6
Vitamin B12
Vit. B12
Vitamin K
Vit. K
Folate
Folate
4.7%
0%
0.33%
0%
116%
46%
88%
54%
69%
0%
0%
53%
9
100 g
300 g
1 tbsp - 9.6g 0.333 cup - 68g
Vitamin C
Vit. C
Vitamin D
Vit. D
Vitamin A
Vit. A
Vitamin E
Vit. E
Vitamin B1
Vit. B1
Vitamin B2
Vit. B2
Vitamin B3
Vit. B3
Vitamin B5
Vit. B5
Vitamin B6
Vit. B6
Vitamin B12
Vit. B12
Vitamin K
Vit. K
Folate
Folate
14%
0%
1.3%
0.8%
151%
20%
115%
43%
92%
2.5%
1.3%
159%
All nutrients comparison - raw data values
Nutrient
DV% diff.
Copper
0.985mg
0.166mg
91%
Polyunsaturated fat
9.65g
0.377g
62%
Selenium
32.4µg
59%
Sodium
229mg
1303mg
47%
Fats
29.4g
1.37g
43%
Folate
71µg
212µg
35%
Magnesium
158mg
32mg
30%
Monounsaturated fat
12.53g
0.373g
30%
Starch
71.23g
29%
Phosphorus
345mg
154mg
27%
Saturated fat
5.55g
0.307g
24%
Zinc
3.22mg
1.01mg
20%
Potassium
685mg
188mg
15%
Vitamin B1
0.462mg
0.603mg
12%
Carbs
44.9g
76.31g
10%
Vitamin B2
0.198mg
0.087mg
9%
Vitamin B3
4.712mg
6.127mg
9%
Iron
3.05mg
2.44mg
8%
Vitamin B6
0.298mg
0.4mg
8%
Protein
13.8g
10.42g
7%
Manganese
1.034mg
0.882mg
7%
Calories
462kcal
359kcal
5%
Fiber
1.2g
5%
Vitamin B5
0.895mg
0.715mg
4%
Vitamin C
1.4mg
4.1mg
3%
Choline
17.5mg
3%
Calcium
78mg
83mg
1%
Vitamin B12
0µg
0.02µg
1%
Protein per 100 calories
3g
2.9g
N/A
Calories per 10 g protein
335kcal
345kcal
N/A
Weight per 100 calories
22g
28g
N/A
Unsaturated / Saturated Fat ratio
4
2.4
N/A
Net carbs
44.9g
75.11g
N/A
Cholesterol
0mg
1mg
0%
Sugar
1.53g
N/A
Vitamin A
1µg
4µg
0%
Vitamin E
0.04mg
0%
Vitamin K
0.5µg
0%
Tryptophan
0.166mg
0.086mg
0%
Threonine
0.482mg
0.221mg
0%
Isoleucine
0.515mg
0.279mg
0%
Leucine
0.89mg
0.523mg
0%
Lysine
0.515mg
0.189mg
0%
Methionine
0.202mg
0.145mg
0%
Phenylalanine
0.658mg
0.32mg
0%
Valine
0.658mg
0.374mg
0%
Histidine
0.357mg
0.15mg
0%
Macronutrient Comparison
Macronutrient breakdown side-by-side comparison
3
14%
29%
45%
9%
3%
Protein:
13.8 g
Fats:
29.4 g
Carbs:
44.9 g
Water:
9.2 g
Other:
2.7 g
2
10%
76%
8%
4%
Protein:
10.42 g
Fats:
1.37 g
Carbs:
76.31 g
Water:
8.04 g
Other:
3.86 g
Contains
more
Protein Protein
+32.4%
Contains
more
Fats Fats
+2046%
Contains
more
Water Water
+14.4%
Contains
more
Carbs Carbs
+70%
Contains
more
Other Other
+43%
Fat Type Comparison
Fat type breakdown side-by-side comparison
2
20%
45%
35%
Saturated fat:
Sat. Fat
5.55 g
Monounsaturated fat:
Mono. Fat
12.53 g
Polyunsaturated fat:
Poly. Fat
9.65 g
1
29%
35%
36%
Saturated fat:
Sat. Fat
0.307 g
Monounsaturated fat:
Mono. Fat
0.373 g
Polyunsaturated fat:
Poly. Fat
0.377 g
Contains
more
Mono. Fat Monounsaturated fat
+3259.2%
Contains
more
Poly. Fat Polyunsaturated fat
+2459.7%
Contains
less
Sat. Fat Saturated fat
-94.5%