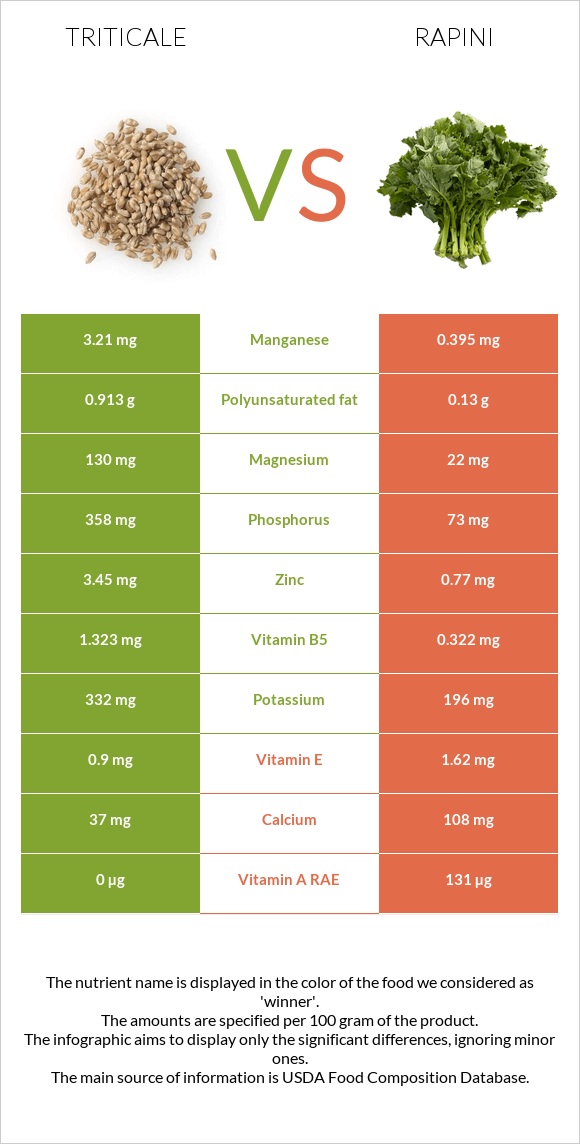
A recap on the differences between triticale and rapini Triticale is higher in manganese, copper, phosphorus, magnesium, zinc, vitamin B1, and vitamin B5, yet rapini is higher in vitamin A, vitamin C, and calcium. Triticale covers your daily manganese needs 122% more than rapini. Triticale contains 11 times more copper than rapini. While triticale contains 0.457mg of copper, rapini contains only 0.042mg. The glycemic index of rapini is lower. Food varieties used in this article are Triticale and Broccoli raab, raw .
Infographic
Mineral Comparison
Mineral comparison score is based on the number of minerals by which one or the other food is richer. The "coverage" charts below show how much of the daily needs can be covered by 300 grams of the food.
8
100 g
300 g
1 cup - 192g
Magnesium
Magnesium
Calcium
Calcium
Potassium
Potassium
Iron
Iron
Copper
Copper
Zinc
Zinc
Phosphorus
Phosphorus
Sodium
Sodium
Manganese
Manganese
Selenium
Selenium
93%
11%
29%
96%
152%
94%
153%
0.65%
419%
0%
2
100 g
300 g
1 stalk - 19g 1 cup chopped - 40g
Magnesium
Magnesium
Calcium
Calcium
Potassium
Potassium
Iron
Iron
Copper
Copper
Zinc
Zinc
Phosphorus
Phosphorus
Sodium
Sodium
Manganese
Manganese
Selenium
Selenium
16%
32%
17%
80%
14%
21%
31%
4.3%
52%
5.5%
Vitamin Comparison
Vitamin comparison score is based on the number of vitamins by which one or the other food is richer. The "coverage" charts below show how much of the daily needs can be covered by 300 grams of the food.
3
100 g
300 g
1 cup - 192g
Vitamin C
Vit. C
Vitamin D
Vit. D
Vitamin A
Vit. A
Vitamin E
Vit. E
Vitamin B1
Vit. B1
Vitamin B2
Vit. B2
Vitamin B3
Vit. B3
Vitamin B5
Vit. B5
Vitamin B6
Vit. B6
Vitamin B12
Vit. B12
Vitamin K
Vit. K
Folate
Folate
0%
0%
0%
18%
104%
31%
27%
79%
32%
0%
0%
55%
6
100 g
300 g
1 stalk - 19g 1 cup chopped - 40g
Vitamin C
Vit. C
Vitamin D
Vit. D
Vitamin A
Vit. A
Vitamin E
Vit. E
Vitamin B1
Vit. B1
Vitamin B2
Vit. B2
Vitamin B3
Vit. B3
Vitamin B5
Vit. B5
Vitamin B6
Vit. B6
Vitamin B12
Vit. B12
Vitamin K
Vit. K
Folate
Folate
67%
0%
44%
32%
41%
30%
23%
19%
39%
0%
560%
62%
All nutrients comparison - raw data values
Nutrient
DV% diff.
Vitamin K
224µg
187%
Manganese
3.21mg
0.395mg
122%
Copper
0.457mg
0.042mg
46%
Phosphorus
358mg
73mg
41%
Magnesium
130mg
22mg
26%
Zinc
3.45mg
0.77mg
24%
Carbs
72.13g
2.85g
23%
Vitamin C
0mg
20.2mg
22%
Vitamin B1
0.416mg
0.162mg
21%
Protein
13.05g
3.17g
20%
Vitamin B5
1.323mg
0.322mg
20%
Calories
336kcal
22kcal
16%
Vitamin A
0µg
131µg
15%
Fiber
2.7g
11%
Calcium
37mg
108mg
7%
Iron
2.57mg
2.14mg
5%
Vitamin E
0.9mg
1.62mg
5%
Polyunsaturated fat
0.913g
0.13g
5%
Potassium
332mg
196mg
4%
Vitamin B6
0.138mg
0.171mg
3%
Folate
73µg
83µg
3%
Choline
18.3mg
3%
Fats
2.09g
0.49g
2%
Selenium
1µg
2%
Sodium
5mg
33mg
1%
Vitamin B3
1.43mg
1.221mg
1%
Saturated fat
0.366g
0.05g
1%
Protein per 100 calories
3.9g
14g
N/A
Calories per 10 g protein
257kcal
69kcal
N/A
Weight per 100 calories
30g
455g
N/A
Unsaturated / Saturated Fat ratio
3.1
3.1
N/A
Net carbs
72.13g
0.15g
N/A
Sugar
0.38g
N/A
Vitamin B2
0.134mg
0.129mg
0%
Monounsaturated fat
0.211g
0.026g
0%
Tryptophan
0.157mg
0.043mg
0%
Threonine
0.405mg
0.106mg
0%
Isoleucine
0.479mg
0.104mg
0%
Leucine
0.911mg
0.17mg
0%
Lysine
0.365mg
0.198mg
0%
Methionine
0.204mg
0.048mg
0%
Phenylalanine
0.638mg
0.128mg
0%
Valine
0.609mg
0.153mg
0%
Histidine
0.311mg
0.066mg
0%
Fructose
0.17g
0%
Macronutrient Comparison
Macronutrient breakdown side-by-side comparison
4
13%
2%
72%
11%
2%
Protein:
13.05 g
Fats:
2.09 g
Carbs:
72.13 g
Water:
10.51 g
Other:
2.22 g
1
3%
3%
93%
Protein:
3.17 g
Fats:
0.49 g
Carbs:
2.85 g
Water:
92.55 g
Other:
0.94 g
Contains
more
Protein Protein
+311.7%
Contains
more
Fats Fats
+326.5%
Contains
more
Carbs Carbs
+2430.9%
Contains
more
Other Other
+136.2%
Contains
more
Water Water
+780.6%
Fat Type Comparison
Fat type breakdown side-by-side comparison
2
25%
14%
61%
Saturated fat:
Sat. Fat
0.366 g
Monounsaturated fat:
Mono. Fat
0.211 g
Polyunsaturated fat:
Poly. Fat
0.913 g
1
24%
13%
63%
Saturated fat:
Sat. Fat
0.05 g
Monounsaturated fat:
Mono. Fat
0.026 g
Polyunsaturated fat:
Poly. Fat
0.13 g
Contains
more
Mono. Fat Monounsaturated fat
+711.5%
Contains
more
Poly. Fat Polyunsaturated fat
+602.3%
Contains
less
Sat. Fat Saturated fat
-86.3%