Rapini nutrition: calories, carbs, GI, protein, fiber, fats
Carbs in Rapini
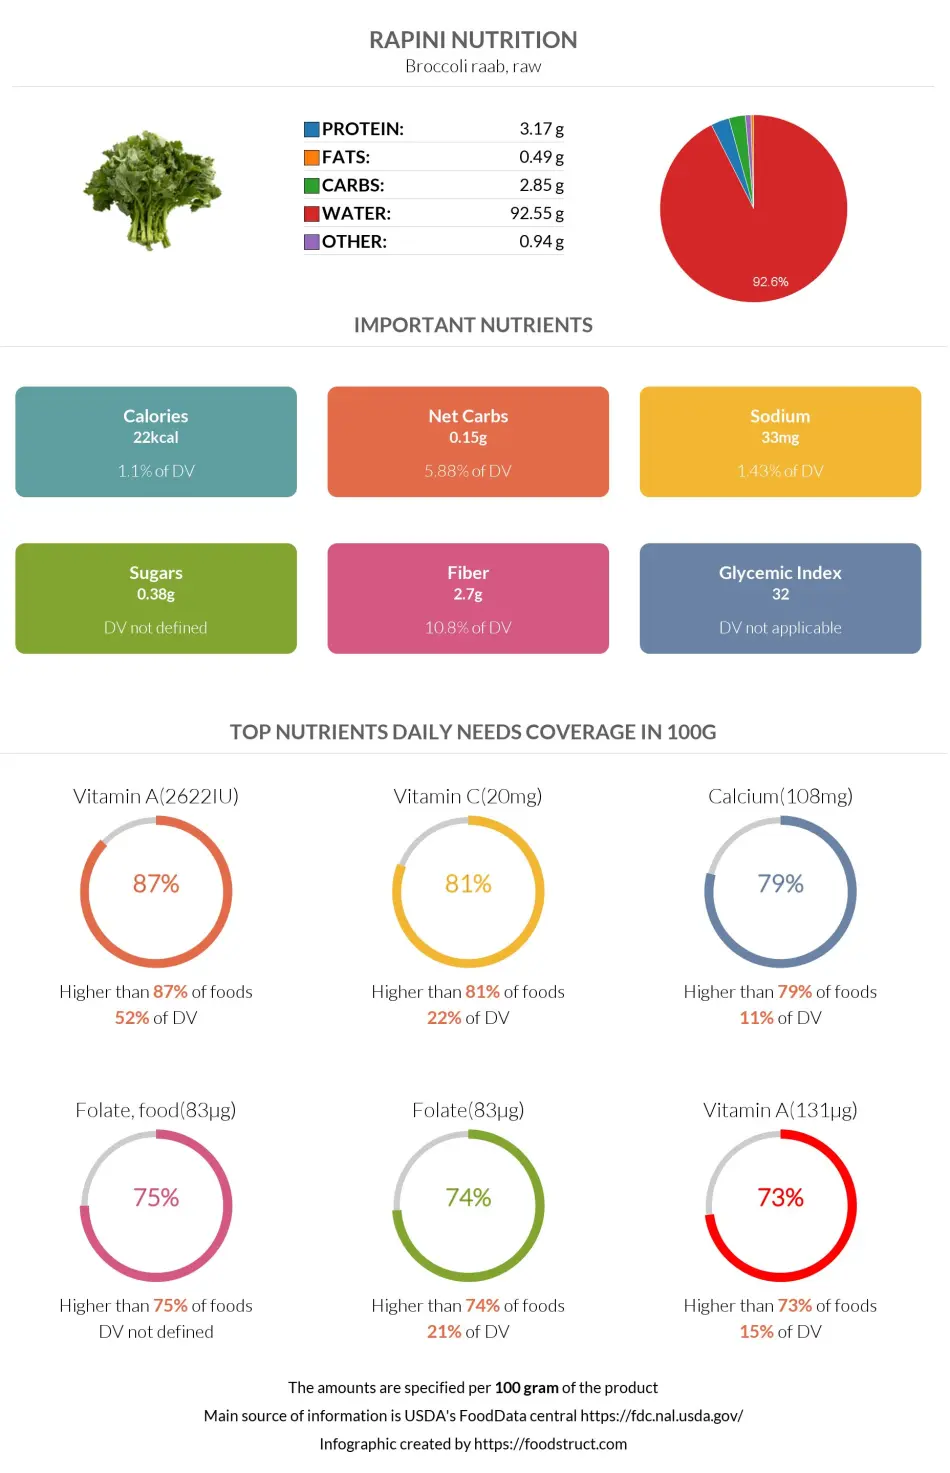
Rapini is one of the vegetables with high water content. 100g of Rapini contains 2.85g of carbs, equal to 1% of the daily carbohydrate requirements.
Macronutrients chart
Carbs per serving size
Rapini is served in one cup chopped (40g). This amount of the vegetable provides 1.14g of carbs.
Rapini net carbs
Net carbs are calculated by subtracting fiber amounts from total carbs.
Rapini provides 2.85g of carbs per 100g, 2.7g of which are fibers. Hence, the net carb content of 100g Rapini is 0.15g.
Carbohydrate type breakdown
In 100g of Rapini, 0.38g of carbs are sugars. You can see in the chart below that the main sugars present in this vegetable are fructose (0.17g), sucrose (0.11g), and glucose (0.1g).
Carbohydrate type breakdown
Soluble or insoluble fiber
The majority of carbs in Rapini are fibers. There are 2.7g of fiber in 100g of this vegetable, equal to 11% of the daily fiber needs. There is soluble and insoluble fiber in Rapini.
Fiber content ratio for Rapini
Rapini calories
Calories per 100g
Rapini is one of the low-calorie foods. A 100g of it contains only 22 calories. These calories come from 3.17g protein and 2.85g carb content of the vegetable. 100g of Rapini covers 1% of the daily calorie requirement.
Calories per serving size
The serving size of Rapini is one cup chopped (40g). This quantity contains 8.8 calories.
Comparison
Rapini is lower in calories than 96% of foods.
Rapini has fewer calories than Broccoli and Rutabagas.
On the other hand, it is higher in calories than Radish.
In the table below, you can compare the calorie content of Rapini with that of some other foods.
| Food | Calories per 100 grams |
| Jerusalem artichoke | 73 |
| Rutabagas | 37 |
| Broccoli | 34 |
| Cauliflower | 25 |
| Rapini | 22 |
| Radish | 16 |
Burning estimates
The table below illustrates how long it takes to burn 8.8 calories (1 cup chopped Rapini) and the type of exercise necessary. This period was evaluated using the MET method (Metabolic Equivalent of a Task) (1) (2).
| 1 cup chopped - 70kg person | 1 cup chopped - 100 kg person | |
| Walking | 3 min | 2 min |
| Running | 2 min | 1 min |
| Cycling | 1 min | 1 min |
REFERENCES

Top nutrition facts for Rapini
| Calories ⓘ Calories for selected serving | 22 kcal |
| Glycemic index ⓘ Gi values are taken from various scientific sources. GI values less than 55 are considered as low. Values above 70 are considered as high. | 32 (low) |
| Glycemic load ⓘ Glycemic Load (GL) is a metric that measures both the quality (Glycemic Index) and quantity of carbohydrates in a specific serving of food to estimate its impact on blood sugar levels. It is calculated as: (GI × Carbs in grams) / 100. | 0 (low) |
| Net carbs ⓘ Net Carbs = Total Carbohydrates – Fiber – Sugar Alcohols | 0 g |
| Default serving size ⓘ Serving sizes are mostly taken from FDA's Reference Amounts Customarily Consumed (RACCs) | 1 cup chopped (40 g) |
| Acidity (Based on PRAL) ⓘ PRAL (Potential renal acid load) is calculated using a formula. On the PRAL scale the higher the positive value, the more is the acidifying effect on the body. The lower the negative value, the higher the alkalinity of the food. 0 is neutral. | -1.8 (alkaline) |
Rapini calories (kcal)
| Calories for different serving sizes of rapini | Calories | Weight |
|---|---|---|
| Calories in 100 grams | 22 | |
| Calories in 1 stalk | 4 | 19 g |
| Calories in 1 cup chopped | 9 | 40 g |
| Calories for different varieties of rapini | Calories | Weight |
|---|---|---|
| Broccoli raab, raw (this food) | 22 | 100 g |
| Broccoli raab, cooked | 33 | 100 g |
Extra Nutrition facts for Rapini
| Protein per 100 calories ⓘ Shows how many grams of protein you get from 100 calories of this food, calculated as (protein in g ÷ calories) × 100. | 14 g |
| Calories per 10 g protein ⓘ Shows how many calories you need to eat from this food to get 10 g of protein, calculated as (calories ÷ protein in g) × 10. | 69 kcal |
| Weight per 100 calories ⓘ Shows how many grams of this food equal 100 kcal—higher grams mean a larger portion for the same calories. | 455 g |
Rapini Glycemic index (GI)
Mineral coverage chart
Mineral chart - relative view
Vitamin coverage chart
Vitamin chart - relative view
Protein quality breakdown
Fat type information
All nutrients for Rapini per 100g
| Nutrient | Value | DV% | In TOP % of foods | Comparison |
| Vitamin A | 131µg | 15% | 10% | |
| Calories | 22kcal | 1% | 97% |
2.1 times less than Orange
|
| Protein per 100 calories | 14g | N/A | 14% | |
| Calories per 10 g protein | 69kcal | N/A | 83% | |
| Weight per 100 calories | 455g | N/A | 4% | |
| Protein | 3.2g | 8% | 70% |
1.1 times more than Broccoli
|
| Fats | 0.49g | 1% | 81% |
68 times less than Cheese
|
| Vitamin C | 20mg | 22% | 10% |
2.6 times less than Lemon
|
| Net carbs | 0.15g | N/A | 74% |
361.1 times less than Chocolate
|
| Carbs | 2.9g | 1% | 67% |
9.9 times less than Rice
|
| Cholesterol | 0mg | 0% | 100% |
N/A
|
| Vitamin D* | 0 IU | 0% | 100% |
N/A
|
| Vitamin D | 0µg | 0% | 100% |
N/A
|
| Magnesium | 22mg | 5% | 46% |
6.4 times less than Almonds
|
| Calcium | 108mg | 11% | 18% |
1.2 times less than Milk
|
| Potassium | 196mg | 6% | 55% |
1.3 times more than Cucumber
|
| Iron | 2.1mg | 27% | 33% |
1.2 times less than Beef broiled
|
| Sugar | 0.38g | N/A | 52% |
23.6 times less than Coca-Cola
|
| Fiber | 2.7g | 11% | 23% |
1.1 times more than Orange
|
| Copper | 0.04mg | 5% | 70% |
3.4 times less than Shiitake
|
| Zinc | 0.77mg | 7% | 52% |
8.2 times less than Beef broiled
|
| Phosphorus | 73mg | 10% | 65% |
2.5 times less than Chicken meat
|
| Sodium | 33mg | 1% | 77% |
14.8 times less than White bread
|
| Vitamin E | 1.6mg | 11% | 9% |
1.1 times more than Kiwi
|
| Manganese | 0.4mg | 17% | 17% | |
| Selenium | 1µg | 2% | 63% | |
| Vitamin B1 | 0.16mg | 14% | 31% |
1.6 times less than Pea raw
|
| Vitamin B2 | 0.13mg | 10% | 56% |
Equal to Avocado
|
| Vitamin B3 | 1.2mg | 8% | 59% |
7.8 times less than Turkey meat
|
| Vitamin B5 | 0.32mg | 6% | 47% |
3.5 times less than Sunflower seeds
|
| Vitamin B6 | 0.17mg | 13% | 43% |
1.4 times more than Oats
|
| Vitamin B12 | 0µg | 0% | 100% |
N/A
|
| Vitamin K | 224µg | 187% | 1% |
2.2 times more than Broccoli
|
| Folate | 83µg | 21% | 13% |
1.4 times more than Brussels sprouts
|
| Trans fat | 0g | N/A | 100% |
N/A
|
| Choline | 18mg | 3% | 31% | |
| Saturated fat | 0.05g | 0% | 82% |
117.9 times less than Beef broiled
|
| Monounsaturated fat | 0.03g | N/A | 81% |
376.9 times less than Avocado
|
| Polyunsaturated fat | 0.13g | N/A | 76% |
362.9 times less than Walnut
|
| Tryptophan | 0.04mg | 0% | 46% |
7.1 times less than Chicken meat
|
| Threonine | 0.11mg | 0% | 48% |
6.8 times less than Beef broiled
|
| Isoleucine | 0.1mg | 0% | 49% |
8.8 times less than Salmon raw
|
| Leucine | 0.17mg | 0% | 50% |
14.3 times less than Tuna Bluefin
|
| Lysine | 0.2mg | 0% | 45% |
2.3 times less than Tofu
|
| Methionine | 0.05mg | 0% | 48% |
2 times less than Quinoa
|
| Phenylalanine | 0.13mg | 0% | 48% |
5.2 times less than Egg
|
| Valine | 0.15mg | 8% | 48% |
13.3 times less than Soybean raw
|
| Histidine | 0.07mg | 0% | 48% |
11.3 times less than Turkey meat
|
| Fructose | 0.17g | 0% | 12% |
34.7 times less than Apple
|
| Caffeine | 0mg | 0% | 100% | |
| Omega-3 - EPA | 0g | N/A | 100% |
N/A
|
| Omega-3 - DHA | 0g | N/A | 100% |
N/A
|
| Omega-3 - DPA | 0g | N/A | 100% |
N/A
|
| Omega-6 - Eicosadienoic acid | 0g | N/A | 100% |
Check out similar food or compare with current

NUTRITION FACTS LABEL
Serving Size ______________
Health checks
Rapini nutrition infographic
References
All the values for which the sources are not specified explicitly are taken from FDA’s Food Central. The exact link to the food presented on this page can be found below.