Tuna vs. Mackerel — Health Impact and Nutrition Comparison


Summary
In short, mackerel is denser in nutrients than tuna. It contains about 18% fat and 24% protein. Meanwhile, tuna has a lower fat content, with only 0.6%, and contains 29% protein.
Compared to tuna, mackerel has higher unsaturated fatty acids, but tuna contains less saturated fat.
Tuna contains more vitamin B6 and vitamin B3 and about 3.4 times more vitamin D than mackerel. Additionally, tuna has vitamins E and K, while mackerel has vitamin C.
Mackerel contains higher levels of calcium, iron, zinc, magnesium, sodium, copper, and manganese compared to tuna, while tuna is richer in phosphorus, potassium, and selenium than mackerel.
Introduction
As the most commonly used marine food, fish are also delicious and have many health benefits. This article shows the main nutritional differences between mackerel and tuna and their impact on human health.
Actual differences
Varieties
The term "mackerel" refers to several different species of pelagic fish. Mackerels primarily comprise the Scombridae family and live near the bottom of oceans or lakes. These fish are blue-green in color and average 30 cm in length.
Tuna, also known as a tunny, is a member of the Scombridae family's Thunnini tribe. Tuna is related to mackerels and kingfish in this family.
Appearance
Raw tuna tends to be darker in color than raw mackerel due to the higher levels of myoglobin and iron. Raw mackerel has gray and greasy colors. When cooked, mackerel and tuna lose color, becoming different light pink or white shades.
Taste and smell
Mackerel usually has a salty and a bit sweeter taste. Since it contains high amounts of oils, its taste may be described as oily, too. When cooked, it has an oily and fishy odor.
In contrast, tuna has a meaty flavor, similar to beef steak. It has a mild, delicate taste. The fresh varieties may have a fishy smell.
Nutrition
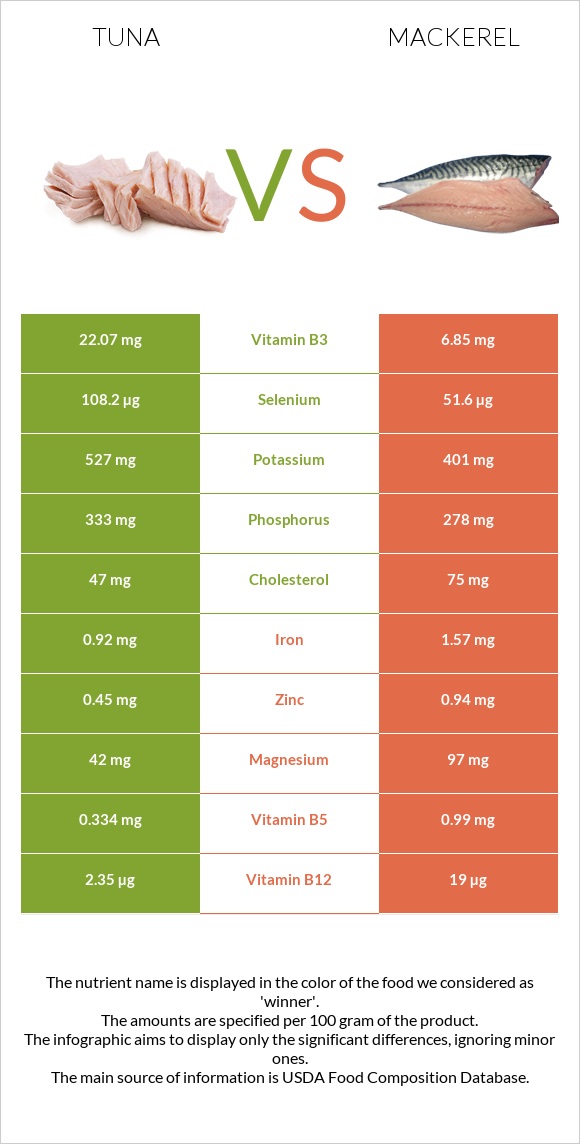
The infographic below presents the nutritional information for 100g servings of mackerel and tuna. However, the average serving size for these fish is 85g.
Calories
Mackerel contains more calories than tuna. This fish contains 262 calories, whereas tuna contains 130 calories per 100g. Both are considered moderate-calorie foods.
Vitamins
Mackerel is rich in vitamin B1, vitamin B2, vitamin B5, vitamin B12, and vitamin A, which are in higher amounts than in tuna. On the other hand, tuna contains more vitamin B6 and vitamin B3 and about 3.4 times more vitamin D than mackerel (82IU and 24IU, respectively). Additionally, tuna has vitamins E and K, while mackerel has vitamin C. Both fish contain the same levels of folate (1).
It is important to note that tuna and mackerel are excellent sources of vitamin B12, with mackerel exceeding the daily recommended amount by 8 times. So, include these fish in your diet to meet your daily vitamin B12 requirements (2).
Vitamin Comparison
Contains
more
Vitamin EVitamin E
+∞%
Contains
more
Vitamin DVitamin D
+∞%
Contains
more
Vitamin B3Vitamin B3
+222.2%
Contains
more
Vitamin B6Vitamin B6
+125.7%
Contains
more
Vitamin KVitamin K
+∞%
Contains
more
Vitamin CVitamin C
+∞%
Contains
more
Vitamin AVitamin A
+145.5%
Contains
more
Vitamin B1Vitamin B1
+18.7%
Contains
more
Vitamin B2Vitamin B2
+200.7%
Contains
more
Vitamin B5Vitamin B5
+196.4%
Contains
more
Vitamin B12Vitamin B12
+708.5%
Minerals
Mackerel has more calcium, iron, zinc, magnesium, sodium, copper, and manganese than tuna. On the other hand, tuna is richer in phosphorus, potassium, and selenium than mackerel.
Mineral Comparison
Contains
more
PotassiumPotassium
+31.4%
Contains
more
PhosphorusPhosphorus
+19.8%
Contains
less
SodiumSodium
-34.9%
Contains
more
SeleniumSelenium
+109.7%
Contains
more
MagnesiumMagnesium
+131%
Contains
more
CalciumCalcium
+275%
Contains
more
IronIron
+70.7%
Contains
more
CopperCopper
+118.6%
Contains
more
ZincZinc
+108.9%
Contains
more
ManganeseManganese
+53.8%
Macronutrients
Mackerel is denser in nutrients than tuna. It contains about 18% fat, 24% protein, 53% water, and 5% other nutrients. On the other hand, tuna has a lower fat content, with only 0.6%, and contains 29% protein, 69% water, and 1.4% other nutrients. For more detailed information, please refer to the sections below.
Macronutrient Comparison
Contains
more
ProteinProtein
+22.2%
Contains
more
WaterWater
+29.5%
Contains
more
FatsFats
+2918.6%
Contains
more
OtherOther
+296.1%
Fats
It is a fact that mackerel has a higher fat content compared to tuna.
It's important to note that mackerel is categorized as one of the top 18% of foods with high-fat content, with 17.81g of fat. On the other hand, tuna has a significantly lower fat content, with only 0.59g.
Compared to tuna, mackerel has higher mono- and polyunsaturated fatty acids, but tuna contains less saturated fat.
Cholesterol
Tuna contains 47mg of cholesterol, while mackerel contains 1.6 times more cholesterol than tuna, which means mackerel contains 75mg of cholesterol.
Fat Type Comparison
Contains
less
Sat. FatSaturated fat
-95.1%
Contains
more
Mono. FatMonounsaturated fat
+4976.8%
Contains
more
Poly. FatPolyunsaturated fat
+2357.1%
Carbs
Both tuna and mackerel have no carbs.
Protein
Tuna provides more protein than mackerel does. Tuna falls in the top 4% of foods as a source of protein, containing 29.15g.
Mackerel has 23.85g of protein. Both of these fishes are excellent sources of essential amino acids.
Glycemic Index
According to the International Tables of Glycemic Index, the glycemic indexes of both mackerel and tuna are equal to 0.
Health impact
Both tuns and mackerel are good sources of healthy nutrients, from omega-3 fatty acids to Vitamin D and proteins.
Cardiovascular Health
The study shows that consuming broiled/ baked tuna or other fish at least thrice weekly significantly reduces the risk of ischemic heart disease death. It is important to note that fried fish intake did not correlate with the same (3).
Consuming fish products rich in omega-3 fatty acids, such as mackerel or tuna, may help reduce arterial blood pressure. Furthermore, omega-3 fatty acids possess several properties that can improve your lipid profile and enhance the structure and function of your heart. These properties include antiarrhythmic, antithrombotic, and anti-atherogenic properties. It should be noted, however, that conducting further clinical trials will determine the most effective dosages and formulas of omega-3 fatty acids for specific pathologies (4.5.6.7).
Eating fatty fish twice a week is essential to reduce the risk of heart disease. The American Heart Association strongly recommends making it a part of your diet to maintain a healthy heart (8.9).
For those struggling with dyslipidemia, it's time to take action. The combination of statins like Atorvastatin and omega-3 fats is a proven treatment option that is both effective and well-tolerated. And for those who have recently experienced a myocardial infarction, this combination can also be of great benefit.
In addition, tuna contains tocopherol, which has anti-inflammatory properties and may decrease the risk of atherosclerosis.
Diabetes
First, these fishes have no carbs, so they will not raise your blood sugar levels after eating.
Besides, research suggests that fish oil may reduce the risk of impaired glucose tolerance and hepatic steatosis. Because of their positive effects on lipoprotein concentrations, omega-3 fatty acids from fatty fish and omega-6 fatty acids from linoleic acid are recommended for patients with type 2 diabetes. Incorporating fish oil into your daily meal or diet can help improve metabolic features associated with type 2 diabetes (10).
Bone Health
Vitamin D and calcium supplements are essential nutrients for bone health.
Mackerels are high in calcium, providing about one-third of the daily requirement for the average person in each serving. They are also high in vitamin D, which is essential for this process because it allows your body to absorb calcium (11).
Eye Health
If you're looking for a natural solution to alleviate dry eye, consider adding mackerel and tuna to your diet. Loaded with omega-3 fatty acids, these fish effectively treat this condition (12).
Side effects
Mercury
Blood mercury levels above 100 ng/ml are associated with clear signs of mercury poisoning in some people. The amount of mercury in fish and other seafood varies according to species and environmental pollution levels.
Larger tuna species, such as bigeye and albacore, have higher mercury levels. Smaller tuna fish, such as light tuna and skipjack, have lower mercury levels. As mercury level depends on tuna varieties, counting the amount you consume is better.
Since king mackerel contains high mercury, it is best to avoid eating it (13).
Sodium
Although sodium is an essential mineral our body needs, it is better to control sodium intake to less than 5g daily. Too much of it may raise blood pressure, and high blood pressure is a significant risk factor for heart disease and stroke; also, it can cause kidney stones (14).
Mackerel has a higher sodium content than tuna. Specifically, mackerel contains 83mg of sodium, while tuna only contains 54mg.
Allergy
Research indicates that 0.4% of adults in the United States are allergic to marine food. Most fish muscles contain the protein parvalbumin, which can cause allergies. Hives, skin rashes, headaches, diarrhea, and difficulty breathing are common symptoms. Both mackerels and tunas have omega-3 fatty acids, which can cause gastrointestinal upset and a fishy aftertaste. However, this is dose-dependent, and it is better to consume them in moderation to avoid allergic reactions (15).
References
- https://www.ncbi.nlm.nih.gov/pmc/articles/PMC2698592/
- https://ods.od.nih.gov/factsheets/VitaminB12-Consumer/
- https://www.ncbi.nlm.nih.gov/pmc/articles/PMC3705336/
- https://link.springer.com/article/10.1007/s13105-013-0265-4
- https://www.europeanreview.org/wp/wp-content/uploads/441-445.pdf
- https://pubmed.ncbi.nlm.nih.gov/37298468/
- https://www.ncbi.nlm.nih.gov/pmc/articles/PMC3712371/
- https://www.ahajournals.org/doi/10.1161/CIR.0000000000001031
- https://www.heart.org/en/healthy-living/healthy-eating/eat-smart/fats/fish-and-omega-3-fatty-acids.
- https://journals.plos.org/plosone/article?id=10.1371/journal.pone.0089845
- https://www.sciencedirect.com/science/article/abs/pii/S0009912012002391
- https://pubmed.ncbi.nlm.nih.gov/37026312/
- https://www.fda.gov/food/environmental-contaminants-food/mercury-levels-commercial-fish-and-shellfish-1990-2012
- https://www.sciencedirect.com/science/article/pii/S2589537021000304
- https://pubmed.ncbi.nlm.nih.gov/27613460/

Infographic
All nutrients comparison - raw data values
| Nutrient | |
|
DV% diff. |
| Vitamin B12 | 2.35µg | 19µg | 694% |
| Selenium | 108.2µg | 51.6µg | 103% |
| Vitamin B3 | 22.07mg | 6.85mg | 95% |
| Vitamin B6 | 1.038mg | 0.46mg | 44% |
| Polyunsaturated fat | 0.175g | 4.3g | 28% |
| Fats | 0.59g | 17.81g | 26% |
| Vitamin B2 | 0.137mg | 0.412mg | 21% |
| Saturated fat | 0.205g | 4.176g | 18% |
| Monounsaturated fat | 0.138g | 7.006g | 17% |
| Choline | 77.6mg | 14% | |
| Magnesium | 42mg | 97mg | 13% |
| Vitamin B5 | 0.334mg | 0.99mg | 13% |
| Protein | 29.15g | 23.85g | 11% |
| Vitamin D | 82 IU | 10% | |
| Vitamin D | 2µg | 10% | |
| Cholesterol | 47mg | 75mg | 9% |
| Iron | 0.92mg | 1.57mg | 8% |
| Phosphorus | 333mg | 278mg | 8% |
| Calories | 130kcal | 262kcal | 7% |
| Copper | 0.043mg | 0.094mg | 6% |
| Potassium | 527mg | 401mg | 4% |
| Zinc | 0.45mg | 0.94mg | 4% |
| Vitamin A | 22µg | 54µg | 4% |
| Vitamin E | 0.29mg | 2% | |
| Vitamin B1 | 0.134mg | 0.159mg | 2% |
| Calcium | 4mg | 15mg | 1% |
| Sodium | 54mg | 83mg | 1% |
| Vitamin C | 0mg | 0.4mg | 0% |
| Manganese | 0.013mg | 0.02mg | 0% |
| Vitamin K | 0.1µg | 0% | |
| Folate | 2µg | 2µg | 0% |
| Trans fat | 0.02g | N/A | |
| Tryptophan | 0.313mg | 0.267mg | 0% |
| Threonine | 1.224mg | 1.045mg | 0% |
| Isoleucine | 1.287mg | 1.099mg | 0% |
| Leucine | 2.27mg | 1.938mg | 0% |
| Lysine | 2.565mg | 2.19mg | 0% |
| Methionine | 0.827mg | 0.706mg | 0% |
| Phenylalanine | 1.091mg | 0.931mg | 0% |
| Valine | 1.438mg | 1.228mg | 0% |
| Histidine | 0.822mg | 0.702mg | 0% |
| Omega-3 - EPA | 0.015g | 0.504g | N/A |
| Omega-3 - DHA | 0.105g | 0.699g | N/A |
| Omega-3 - DPA | 0.005g | 0.106g | N/A |
| Omega-6 - Eicosadienoic acid | 0.002g | N/A |
People also compare


References
All the values for which the sources are not specified explicitly are taken from FDA’s Food Central. The exact link to the food presented on this page can be found below.
- Tuna - https://fdc.nal.usda.gov/fdc-app.html#/food-details/172006/nutrients
- Mackerel - https://fdc.nal.usda.gov/fdc-app.html#/food-details/175120/nutrients
All the Daily Values are presented for males aged 31-50, for 2000-calorie diets.