Tuna vs. Orange roughy — In-Depth Nutrition Comparison
Compare
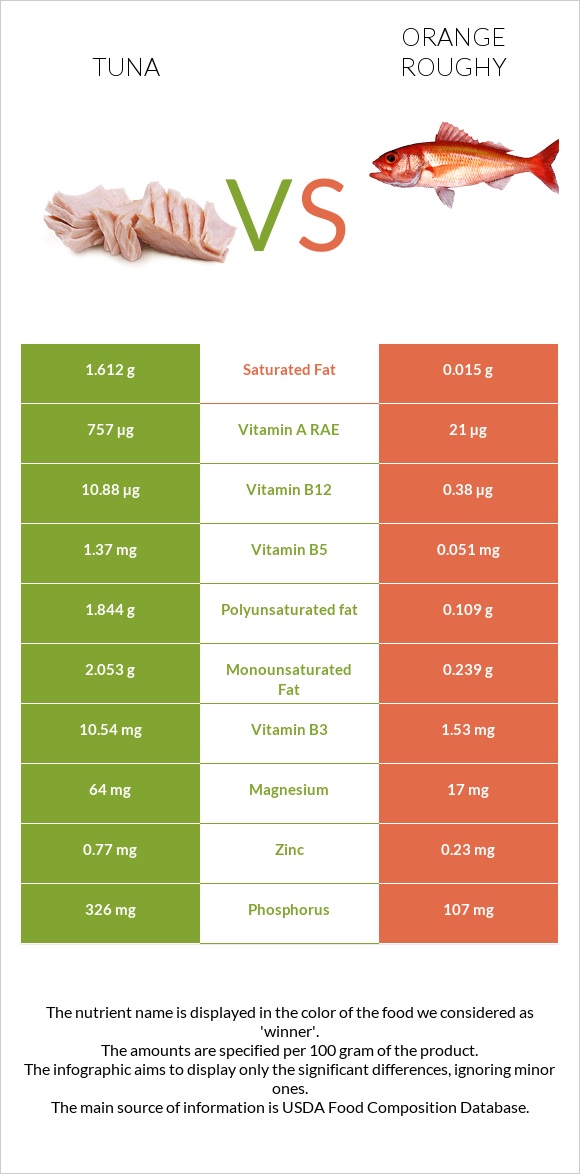
Summary of differences between tuna and orange roughy
- Tuna has more vitamin B3, vitamin B12, vitamin B6, selenium, phosphorus, potassium, vitamin B1, and magnesium, while orange roughy has more vitamin E.
- Tuna covers your daily need for vitamin B3, 127% more than orange roughy.
- Tuna contains 15 times more vitamin B6 than orange roughy. While tuna contains 1.038mg of vitamin B6, orange roughy contains only 0.067mg.
- The amount of cholesterol in tuna is lower.
These are the specific foods used in this comparison Fish, tuna, yellowfin, fresh, cooked, dry heat and Fish, roughy, orange, cooked, dry heat.
Infographic
Infographic link
Mineral Comparison
Mineral comparison score is based on the number of minerals by which one or the other food is richer. The "coverage" charts below show how much of the daily needs can be covered by 300 grams of the food.
| Contains more MagnesiumMagnesium | +133.3% |
| Contains more PotassiumPotassium | +191.2% |
| Contains more ZincZinc | +40.6% |
| Contains more PhosphorusPhosphorus | +226.5% |
| Contains less SodiumSodium | -21.7% |
| Contains more SeleniumSelenium | +22.5% |
| Contains more CalciumCalcium | +175% |
| Contains more IronIron | +22.8% |
| Contains more CopperCopper | +74.4% |
| Contains more ManganeseManganese | +184.6% |
Vitamin Comparison
Vitamin comparison score is based on the number of vitamins by which one or the other food is richer. The "coverage" charts below show how much of the daily needs can be covered by 300 grams of the food.
| Contains more Vitamin DVitamin D | +∞% |
| Contains more Vitamin B1Vitamin B1 | +197.8% |
| Contains more Vitamin B2Vitamin B2 | +117.5% |
| Contains more Vitamin B3Vitamin B3 | +1112.6% |
| Contains more Vitamin B5Vitamin B5 | +496.4% |
| Contains more Vitamin B6Vitamin B6 | +1449.3% |
| Contains more Vitamin B12Vitamin B12 | +400% |
| Contains more Vitamin EVitamin E | +544.8% |
| Contains more Vitamin KVitamin K | +1000% |
| Contains more FolateFolate | +150% |
All nutrients comparison - raw data values
| Nutrient |  |
 |
DV% diff. |
| Vitamin B3 | 22.07mg | 1.82mg | 127% |
| Vitamin B12 | 2.35µg | 0.47µg | 78% |
| Vitamin B6 | 1.038mg | 0.067mg | 75% |
| Selenium | 108.2µg | 88.3µg | 36% |
| Phosphorus | 333mg | 102mg | 33% |
| Choline | 77.6mg | 14% | |
| Protein | 29.15g | 22.64g | 13% |
| Cholesterol | 47mg | 80mg | 11% |
| Vitamin E | 0.29mg | 1.87mg | 11% |
| Vitamin D | 82 IU | 10% | |
| Potassium | 527mg | 181mg | 10% |
| Vitamin D | 2µg | 10% | |
| Vitamin B1 | 0.134mg | 0.045mg | 7% |
| Magnesium | 42mg | 18mg | 6% |
| Vitamin B2 | 0.137mg | 0.063mg | 6% |
| Vitamin B5 | 0.334mg | 0.056mg | 6% |
| Copper | 0.043mg | 0.075mg | 4% |
| Iron | 0.92mg | 1.13mg | 3% |
| Calories | 130kcal | 105kcal | 1% |
| Calcium | 4mg | 11mg | 1% |
| Zinc | 0.45mg | 0.32mg | 1% |
| Sodium | 54mg | 69mg | 1% |
| Manganese | 0.013mg | 0.037mg | 1% |
| Vitamin K | 0.1µg | 1.1µg | 1% |
| Folate | 2µg | 5µg | 1% |
| Saturated fat | 0.205g | 0.034g | 1% |
| Monounsaturated fat | 0.138g | 0.439g | 1% |
| Fats | 0.59g | 0.9g | 0% |
| Vitamin A | 22µg | 24µg | 0% |
| Trans fat | 0.02g | N/A | |
| Polyunsaturated fat | 0.175g | 0.184g | 0% |
| Tryptophan | 0.313mg | 0.23mg | 0% |
| Threonine | 1.224mg | 1.03mg | 0% |
| Isoleucine | 1.287mg | 1.058mg | 0% |
| Leucine | 2.27mg | 1.797mg | 0% |
| Lysine | 2.565mg | 2.092mg | 0% |
| Methionine | 0.827mg | 0.728mg | 0% |
| Phenylalanine | 1.091mg | 0.869mg | 0% |
| Valine | 1.438mg | 1.083mg | 0% |
| Histidine | 0.822mg | 0.474mg | 0% |
| Omega-3 - EPA | 0.015g | 0.006g | N/A |
| Omega-3 - DHA | 0.105g | 0.025g | N/A |
| Omega-3 - DPA | 0.005g | 0.001g | N/A |
| Omega-6 - Eicosadienoic acid | 0.002g | 0.069g | N/A |
Macronutrient Comparison
Macronutrient breakdown side-by-side comparison
Protein:
29.15 g
Fats:
0.59 g
Carbs:
0 g
Water:
68.98 g
Other:
1.28 g
Protein:
22.64 g
Fats:
0.9 g
Carbs:
0 g
Water:
66.97 g
Other:
9.49 g
| Contains more ProteinProtein | +28.8% |
| Contains more FatsFats | +52.5% |
| Contains more OtherOther | +641.4% |
~equal in
Carbs
~0g
~equal in
Water
~66.97g
Fat Type Comparison
Fat type breakdown side-by-side comparison
Saturated fat:
Sat. Fat
0.205 g
Monounsaturated fat:
Mono. Fat
0.138 g
Polyunsaturated fat:
Poly. Fat
0.175 g
Saturated fat:
Sat. Fat
0.034 g
Monounsaturated fat:
Mono. Fat
0.439 g
Polyunsaturated fat:
Poly. Fat
0.184 g
| Contains less Sat. FatSaturated fat | -83.4% |
| Contains more Mono. FatMonounsaturated fat | +218.1% |
~equal in
Polyunsaturated fat
~0.184g


