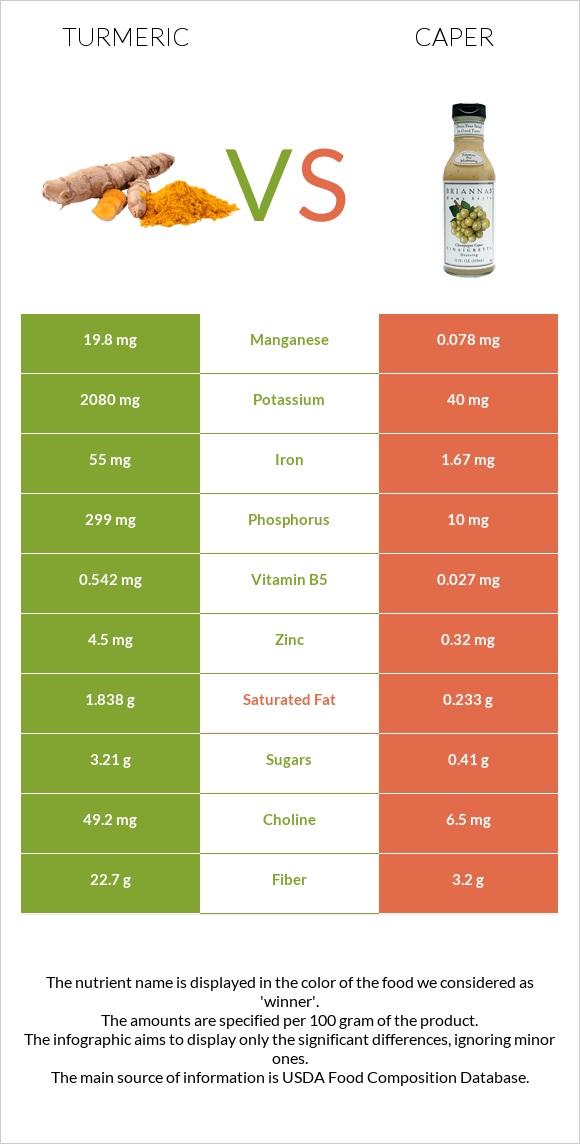
What are the differences between turmeric and caper? Turmeric is richer than caper in manganese, iron, copper, fiber, potassium, magnesium, phosphorus, zinc, and vitamin E. Turmeric's daily need coverage for manganese is 857% more. Turmeric has 52 times more potassium than caper. While turmeric has 2080mg of potassium, caper has only 40mg. The amount of sodium in turmeric is lower. We used Spices, turmeric, ground and Capers, canned types in this article.
Infographic
Mineral Comparison
Mineral comparison score is based on the number of minerals by which one or the other food is richer. The "coverage" charts below show how much of the daily needs can be covered by 300 grams of the food.
10
100 g
300 g
0.25 tsp - 0.5g 1 tbsp - 9.4g
Magnesium
Magnesium
Calcium
Calcium
Potassium
Potassium
Iron
Iron
Copper
Copper
Zinc
Zinc
Phosphorus
Phosphorus
Sodium
Sodium
Manganese
Manganese
Selenium
Selenium
149%
50%
184%
2063%
433%
123%
128%
3.5%
2583%
34%
0
100 g
300 g
1 tbsp, drained - 8.6g
Magnesium
Magnesium
Calcium
Calcium
Potassium
Potassium
Iron
Iron
Copper
Copper
Zinc
Zinc
Phosphorus
Phosphorus
Sodium
Sodium
Manganese
Manganese
Selenium
Selenium
24%
12%
3.5%
63%
125%
8.7%
4.3%
306%
10%
6.5%
Vitamin Comparison
Vitamin comparison score is based on the number of vitamins by which one or the other food is richer. The "coverage" charts below show how much of the daily needs can be covered by 300 grams of the food.
5
100 g
300 g
0.25 tsp - 0.5g 1 tbsp - 9.4g
Vitamin C
Vit. C
Vitamin D
Vit. D
Vitamin A
Vit. A
Vitamin E
Vit. E
Vitamin B1
Vit. B1
Vitamin B2
Vit. B2
Vitamin B3
Vit. B3
Vitamin B5
Vit. B5
Vitamin B6
Vit. B6
Vitamin B12
Vit. B12
Vitamin K
Vit. K
Folate
Folate
2.3%
0%
0%
89%
15%
35%
25%
33%
25%
0%
34%
15%
4
100 g
300 g
1 tbsp, drained - 8.6g
Vitamin C
Vit. C
Vitamin D
Vit. D
Vitamin A
Vit. A
Vitamin E
Vit. E
Vitamin B1
Vit. B1
Vitamin B2
Vit. B2
Vitamin B3
Vit. B3
Vitamin B5
Vit. B5
Vitamin B6
Vit. B6
Vitamin B12
Vit. B12
Vitamin K
Vit. K
Folate
Folate
14%
0%
2.3%
18%
4.5%
32%
12%
1.6%
5.3%
0%
62%
17%
All nutrients comparison - raw data values
Nutrient
DV% diff.
Manganese
19.8mg
0.078mg
857%
Iron
55mg
1.67mg
667%
Copper
1.3mg
0.374mg
103%
Sodium
27mg
2348mg
101%
Fiber
22.7g
3.2g
78%
Potassium
2080mg
40mg
60%
Magnesium
208mg
33mg
42%
Phosphorus
299mg
10mg
41%
Zinc
4.5mg
0.32mg
38%
Vitamin E
4.43mg
0.88mg
24%
Carbs
67.14g
4.89g
21%
Protein
9.68g
2.36g
15%
Calories
312kcal
23kcal
14%
Calcium
168mg
40mg
13%
Vitamin B5
0.542mg
0.027mg
10%
Selenium
6.2µg
1.2µg
9%
Vitamin K
13.4µg
24.6µg
9%
Choline
49.2mg
6.5mg
8%
Saturated fat
1.838g
0.233g
7%
Vitamin B6
0.107mg
0.023mg
6%
Fats
3.25g
0.86g
4%
Vitamin C
0.7mg
4.3mg
4%
Vitamin B3
1.35mg
0.652mg
4%
Vitamin B1
0.058mg
0.018mg
3%
Polyunsaturated fat
0.756g
0.304g
3%
Vitamin A
0µg
7µg
1%
Vitamin B2
0.15mg
0.139mg
1%
Folate
20µg
23µg
1%
Monounsaturated fat
0.449g
0.063g
1%
Fructose
0.45g
1%
Protein per 100 calories
3.1g
10g
N/A
Calories per 10 g protein
322kcal
97kcal
N/A
Weight per 100 calories
32g
435g
N/A
Unsaturated / Saturated Fat ratio
0.66
1.6
N/A
Net carbs
44.44g
1.69g
N/A
Sugar
3.21g
0.41g
N/A
Trans fat
0.056g
0g
N/A
Tryptophan
0.17mg
0%
Threonine
0.33mg
0%
Isoleucine
0.47mg
0%
Leucine
0.81mg
0%
Lysine
0.38mg
0%
Methionine
0.14mg
0%
Phenylalanine
0.53mg
0%
Valine
0.66mg
0%
Histidine
0.15mg
0%
Omega-3 - ALA
0.003g
N/A
Omega-3 - DPA
0g
0.001g
N/A
Omega-6 - Gamma-linoleic acid
0.081g
N/A
Macronutrient Comparison
Macronutrient breakdown side-by-side comparison
3
10%
3%
67%
13%
7%
Protein:
9.68 g
Fats:
3.25 g
Carbs:
67.14 g
Water:
12.85 g
Other:
7.08 g
2
2%
5%
84%
8%
Protein:
2.36 g
Fats:
0.86 g
Carbs:
4.89 g
Water:
83.85 g
Other:
8.04 g
Contains
more
Protein Protein
+310.2%
Contains
more
Fats Fats
+277.9%
Contains
more
Carbs Carbs
+1273%
Contains
more
Water Water
+552.5%
Contains
more
Other Other
+13.6%
Fat Type Comparison
Fat type breakdown side-by-side comparison
2
60%
15%
25%
Saturated fat:
Sat. Fat
1.838 g
Monounsaturated fat:
Mono. Fat
0.449 g
Polyunsaturated fat:
Poly. Fat
0.756 g
1
39%
11%
51%
Saturated fat:
Sat. Fat
0.233 g
Monounsaturated fat:
Mono. Fat
0.063 g
Polyunsaturated fat:
Poly. Fat
0.304 g
Contains
more
Mono. Fat Monounsaturated fat
+612.7%
Contains
more
Poly. Fat Polyunsaturated fat
+148.7%
Contains
less
Sat. Fat Saturated fat
-87.3%