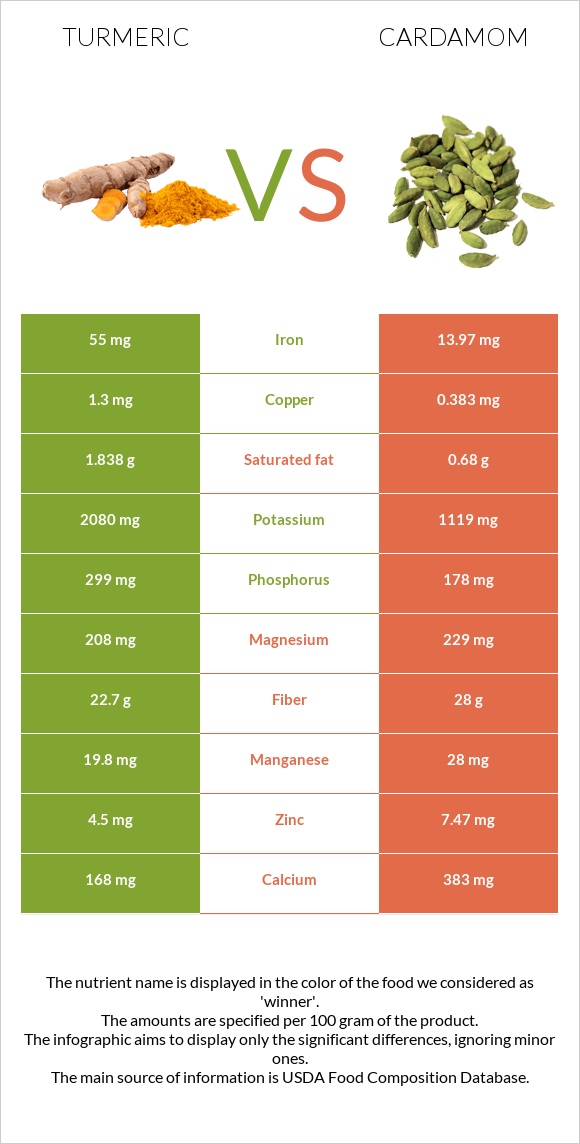
How are turmeric and cardamom different? Turmeric is higher in iron, copper, potassium, and phosphorus; however, cardamom is richer in manganese, zinc, vitamin C, calcium, fiber, and vitamin B1. Daily need coverage for iron for turmeric is 513% higher. Turmeric contains 3 times more copper than cardamom. While turmeric contains 1.3mg of copper, cardamom contains only 0.383mg. Spices, turmeric, ground and Spices, cardamom are the varieties used in this article.
Infographic
Mineral Comparison
Mineral comparison score is based on the number of minerals by which one or the other food is richer. The "coverage" charts below show how much of the daily needs can be covered by 300 grams of the food.
5
100 g
300 g
0.25 tsp - 0.5g 1 tbsp - 9.4g
Magnesium
Magnesium
Calcium
Calcium
Potassium
Potassium
Iron
Iron
Copper
Copper
Zinc
Zinc
Phosphorus
Phosphorus
Sodium
Sodium
Manganese
Manganese
Selenium
Selenium
149%
50%
184%
2063%
433%
123%
128%
3.5%
2583%
34%
5
100 g
300 g
1 tsp, ground - 2g 1 tbsp, ground - 5.8g
Magnesium
Magnesium
Calcium
Calcium
Potassium
Potassium
Iron
Iron
Copper
Copper
Zinc
Zinc
Phosphorus
Phosphorus
Sodium
Sodium
Manganese
Manganese
Selenium
Selenium
164%
115%
99%
524%
128%
204%
76%
2.3%
3652%
0%
Vitamin Comparison
Vitamin comparison score is based on the number of vitamins by which one or the other food is richer. The "coverage" charts below show how much of the daily needs can be covered by 300 grams of the food.
5
100 g
300 g
0.25 tsp - 0.5g 1 tbsp - 9.4g
Vitamin C
Vit. C
Vitamin D
Vit. D
Vitamin A
Vit. A
Vitamin E
Vit. E
Vitamin B1
Vit. B1
Vitamin B2
Vit. B2
Vitamin B3
Vit. B3
Vitamin B5
Vit. B5
Vitamin B6
Vit. B6
Vitamin B12
Vit. B12
Vitamin K
Vit. K
Folate
Folate
2.3%
0%
0%
89%
15%
35%
25%
33%
25%
0%
34%
15%
4
100 g
300 g
1 tsp, ground - 2g 1 tbsp, ground - 5.8g
Vitamin C
Vit. C
Vitamin D
Vit. D
Vitamin A
Vit. A
Vitamin E
Vit. E
Vitamin B1
Vit. B1
Vitamin B2
Vit. B2
Vitamin B3
Vit. B3
Vitamin B5
Vit. B5
Vitamin B6
Vit. B6
Vitamin B12
Vit. B12
Vitamin K
Vit. K
Folate
Folate
70%
0%
0%
0%
50%
42%
21%
0%
53%
0%
0%
0%
All nutrients comparison - raw data values
Nutrient
DV% diff.
Iron
55mg
13.97mg
513%
Manganese
19.8mg
28mg
357%
Copper
1.3mg
0.383mg
102%
Vitamin E
4.43mg
30%
Potassium
2080mg
1119mg
28%
Zinc
4.5mg
7.47mg
27%
Vitamin C
0.7mg
21mg
23%
Calcium
168mg
383mg
22%
Fiber
22.7g
28g
21%
Phosphorus
299mg
178mg
17%
Vitamin B1
0.058mg
0.198mg
12%
Selenium
6.2µg
11%
Vitamin B5
0.542mg
11%
Vitamin K
13.4µg
11%
Vitamin B6
0.107mg
0.23mg
9%
Choline
49.2mg
9%
Fats
3.25g
6.7g
5%
Magnesium
208mg
229mg
5%
Folate
20µg
5%
Saturated fat
1.838g
0.68g
5%
Protein
9.68g
10.76g
2%
Vitamin B2
0.15mg
0.182mg
2%
Vitamin B3
1.35mg
1.102mg
2%
Polyunsaturated fat
0.756g
0.43g
2%
Monounsaturated fat
0.449g
0.87g
1%
Fructose
0.45g
1%
Calories
312kcal
311kcal
0%
Protein per 100 calories
3.1g
3.5g
N/A
Calories per 10 g protein
322kcal
289kcal
N/A
Weight per 100 calories
32g
32g
N/A
Unsaturated / Saturated Fat ratio
0.66
1.9
N/A
Net carbs
44.44g
40.47g
N/A
Carbs
67.14g
68.47g
0%
Sugar
3.21g
N/A
Sodium
27mg
18mg
0%
Trans fat
0.056g
0g
N/A
Tryptophan
0.17mg
0%
Threonine
0.33mg
0%
Isoleucine
0.47mg
0%
Leucine
0.81mg
0%
Lysine
0.38mg
0%
Methionine
0.14mg
0%
Phenylalanine
0.53mg
0%
Valine
0.66mg
0%
Histidine
0.15mg
0%
Omega-3 - ALA
0.003g
N/A
Omega-6 - Gamma-linoleic acid
0.081g
N/A
Macronutrient Comparison
Macronutrient breakdown side-by-side comparison
2
10%
3%
67%
13%
7%
Protein:
9.68 g
Fats:
3.25 g
Carbs:
67.14 g
Water:
12.85 g
Other:
7.08 g
3
11%
7%
68%
8%
6%
Protein:
10.76 g
Fats:
6.7 g
Carbs:
68.47 g
Water:
8.28 g
Other:
5.79 g
Contains
more
Water Water
+55.2%
Contains
more
Other Other
+22.3%
Contains
more
Protein Protein
+11.2%
Contains
more
Fats Fats
+106.2%
Fat Type Comparison
Fat type breakdown side-by-side comparison
1
60%
15%
25%
Saturated fat:
Sat. Fat
1.838 g
Monounsaturated fat:
Mono. Fat
0.449 g
Polyunsaturated fat:
Poly. Fat
0.756 g
2
34%
44%
22%
Saturated fat:
Sat. Fat
0.68 g
Monounsaturated fat:
Mono. Fat
0.87 g
Polyunsaturated fat:
Poly. Fat
0.43 g
Contains
more
Poly. Fat Polyunsaturated fat
+75.8%
Contains
less
Sat. Fat Saturated fat
-63%
Contains
more
Mono. Fat Monounsaturated fat
+93.8%