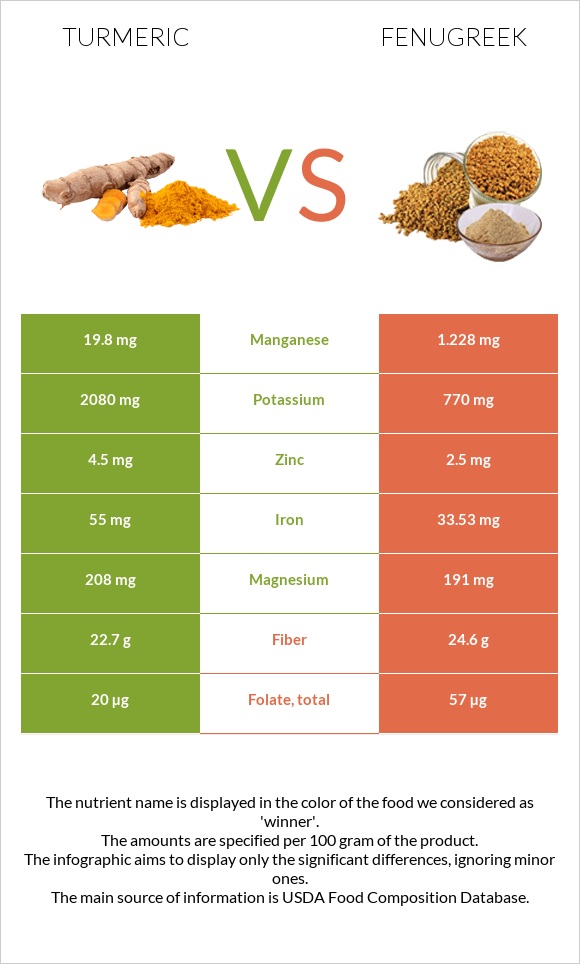
Important differences between turmeric and fenugreek Turmeric has more manganese, iron, potassium, copper, and zinc; however, fenugreek has more vitamin B6, vitamin B1, vitamin B2, folate, and fiber. Turmeric's daily need coverage for manganese is 807% more. Turmeric has 3 times more potassium than fenugreek. Turmeric has 2080mg of potassium, while fenugreek has 770mg. The food varieties used in the comparison are Spices, turmeric, ground and Spices, fenugreek seed .
Infographic
Mineral Comparison
Mineral comparison score is based on the number of minerals by which one or the other food is richer. The "coverage" charts below show how much of the daily needs can be covered by 300 grams of the food.
6
100 g
300 g
0.25 tsp - 0.5g 1 tbsp - 9.4g
Magnesium
Magnesium
Calcium
Calcium
Potassium
Potassium
Iron
Iron
Copper
Copper
Zinc
Zinc
Phosphorus
Phosphorus
Sodium
Sodium
Manganese
Manganese
Selenium
Selenium
149%
50%
184%
2063%
433%
123%
128%
3.5%
2583%
34%
0
100 g
300 g
0.25 tsp - 0.5g 1 tbsp - 11.1g
Magnesium
Magnesium
Calcium
Calcium
Potassium
Potassium
Iron
Iron
Copper
Copper
Zinc
Zinc
Phosphorus
Phosphorus
Sodium
Sodium
Manganese
Manganese
Selenium
Selenium
136%
53%
68%
1257%
370%
68%
127%
8.7%
160%
34%
Vitamin Comparison
Vitamin comparison score is based on the number of vitamins by which one or the other food is richer. The "coverage" charts below show how much of the daily needs can be covered by 300 grams of the food.
3
100 g
300 g
0.25 tsp - 0.5g 1 tbsp - 9.4g
Vitamin C
Vit. C
Vitamin D
Vit. D
Vitamin A
Vit. A
Vitamin E
Vit. E
Vitamin B1
Vit. B1
Vitamin B2
Vit. B2
Vitamin B3
Vit. B3
Vitamin B5
Vit. B5
Vitamin B6
Vit. B6
Vitamin B12
Vit. B12
Vitamin K
Vit. K
Folate
Folate
2.3%
0%
0%
89%
15%
35%
25%
33%
25%
0%
34%
15%
7
100 g
300 g
0.25 tsp - 0.5g 1 tbsp - 11.1g
Vitamin C
Vit. C
Vitamin D
Vit. D
Vitamin A
Vit. A
Vitamin E
Vit. E
Vitamin B1
Vit. B1
Vitamin B2
Vit. B2
Vitamin B3
Vit. B3
Vitamin B5
Vit. B5
Vitamin B6
Vit. B6
Vitamin B12
Vit. B12
Vitamin K
Vit. K
Folate
Folate
10%
0%
1%
0%
81%
84%
31%
0%
138%
0%
0%
43%
All nutrients comparison - raw data values
Nutrient
DV% diff.
Manganese
19.8mg
1.228mg
807%
Iron
55mg
33.53mg
268%
Potassium
2080mg
770mg
39%
Vitamin B6
0.107mg
0.6mg
38%
Vitamin E
4.43mg
30%
Protein
9.68g
23g
27%
Vitamin B1
0.058mg
0.322mg
22%
Copper
1.3mg
1.11mg
21%
Zinc
4.5mg
2.5mg
18%
Vitamin B2
0.15mg
0.366mg
17%
Vitamin B5
0.542mg
11%
Vitamin K
13.4µg
11%
Folate
20µg
57µg
9%
Choline
49.2mg
9%
Fiber
22.7g
24.6g
8%
Fats
3.25g
6.41g
5%
Polyunsaturated fat
0.756g
5%
Magnesium
208mg
191mg
4%
Vitamin C
0.7mg
3mg
3%
Carbs
67.14g
58.35g
3%
Sodium
27mg
67mg
2%
Vitamin B3
1.35mg
1.64mg
2%
Saturated fat
1.838g
1.46g
2%
Calories
312kcal
323kcal
1%
Calcium
168mg
176mg
1%
Monounsaturated fat
0.449g
1%
Fructose
0.45g
1%
Protein per 100 calories
3.1g
7.1g
N/A
Calories per 10 g protein
322kcal
140kcal
N/A
Weight per 100 calories
32g
31g
N/A
Unsaturated / Saturated Fat ratio
0.66
0
N/A
Net carbs
44.44g
33.75g
N/A
Sugar
3.21g
N/A
Phosphorus
299mg
296mg
0%
Vitamin A
0µg
3µg
0%
Selenium
6.2µg
6.3µg
0%
Trans fat
0.056g
0g
N/A
Tryptophan
0.17mg
0.391mg
0%
Threonine
0.33mg
0.898mg
0%
Isoleucine
0.47mg
1.241mg
0%
Leucine
0.81mg
1.757mg
0%
Lysine
0.38mg
1.684mg
0%
Methionine
0.14mg
0.338mg
0%
Phenylalanine
0.53mg
1.089mg
0%
Valine
0.66mg
1.102mg
0%
Histidine
0.15mg
0.668mg
0%
Omega-3 - ALA
0.003g
N/A
Omega-6 - Gamma-linoleic acid
0.081g
N/A
Macronutrient Comparison
Macronutrient breakdown side-by-side comparison
3
10%
3%
67%
13%
7%
Protein:
9.68 g
Fats:
3.25 g
Carbs:
67.14 g
Water:
12.85 g
Other:
7.08 g
2
23%
6%
58%
9%
3%
Protein:
23 g
Fats:
6.41 g
Carbs:
58.35 g
Water:
8.84 g
Other:
3.4 g
Contains
more
Carbs Carbs
+15.1%
Contains
more
Water Water
+45.4%
Contains
more
Other Other
+108.2%
Contains
more
Protein Protein
+137.6%
Contains
more
Fats Fats
+97.2%
Fat Type Comparison
Fat type breakdown side-by-side comparison
2
60%
15%
25%
Saturated fat:
Sat. Fat
1.838 g
Monounsaturated fat:
Mono. Fat
0.449 g
Polyunsaturated fat:
Poly. Fat
0.756 g
1
100%
Saturated fat:
Sat. Fat
1.46 g
Monounsaturated fat:
Mono. Fat
0 g
Polyunsaturated fat:
Poly. Fat
0 g
Contains
more
Mono. Fat Monounsaturated fat
+∞%
Contains
more
Poly. Fat Polyunsaturated fat
+∞%
Contains
less
Sat. Fat Saturated fat
-20.6%