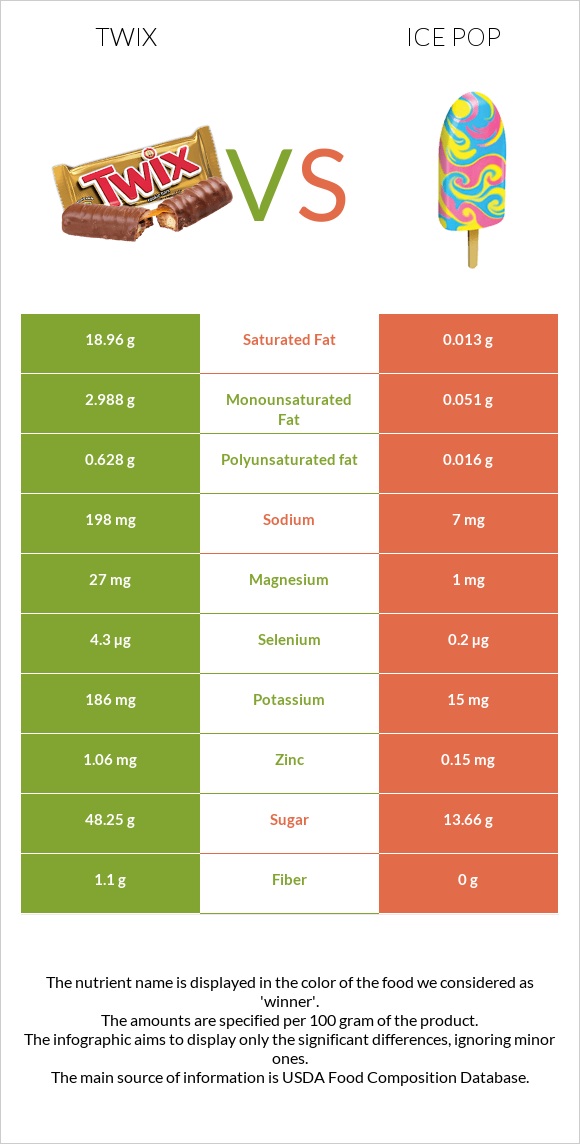
Summary of differences between Twix and ice pop The amount of copper, vitamin B2, phosphorus, vitamin B12, vitamin B1, manganese, calcium, and zinc in Twix is higher than in ice pop. Twix covers your daily need for saturated fat, 95% more than ice pop. The amount of saturated fat in ice pop is lower. These are the specific foods used in this comparison Candies, MARS SNACKFOOD US, TWIX Caramel Cookie Bars and Frozen novelties, ice type, pop .
Infographic
Mineral Comparison
Mineral comparison score is based on the number of minerals by which one or the other food is richer. The "coverage" charts below show how much of the daily needs can be covered by 300 grams of the food.
9
100 g
300 g
1 package (2 oz) - 57g 1 package (2.06 oz, 2 bars) - 58g 1 package, king size (3.35 oz, 4 bars) - 95g 1 package (11 oz) - 312g
Magnesium
Magnesium
Calcium
Calcium
Potassium
Potassium
Iron
Iron
Copper
Copper
Zinc
Zinc
Phosphorus
Phosphorus
Sodium
Sodium
Manganese
Manganese
Selenium
Selenium
19%
32%
16%
30%
66%
29%
45%
26%
36%
23%
1
100 g
300 g
1 serving 1.75 fl oz pop - 52g
Magnesium
Magnesium
Calcium
Calcium
Potassium
Potassium
Iron
Iron
Copper
Copper
Zinc
Zinc
Phosphorus
Phosphorus
Sodium
Sodium
Manganese
Manganese
Selenium
Selenium
0.71%
0%
1.3%
20%
0%
4.1%
0%
0.91%
0%
1.1%
Vitamin Comparison
Vitamin comparison score is based on the number of vitamins by which one or the other food is richer. The "coverage" charts below show how much of the daily needs can be covered by 300 grams of the food.
10
100 g
300 g
1 package (2 oz) - 57g 1 package (2.06 oz, 2 bars) - 58g 1 package, king size (3.35 oz, 4 bars) - 95g 1 package (11 oz) - 312g
Vitamin C
Vit. C
Vitamin D
Vit. D
Vitamin A
Vit. A
Vitamin E
Vit. E
Vitamin B1
Vit. B1
Vitamin B2
Vit. B2
Vitamin B3
Vit. B3
Vitamin B5
Vit. B5
Vitamin B6
Vit. B6
Vitamin B12
Vit. B12
Vitamin K
Vit. K
Folate
Folate
2%
0%
6.7%
15%
39%
48%
21%
16%
5.8%
41%
14%
20%
1
100 g
300 g
1 serving 1.75 fl oz pop - 52g
Vitamin C
Vit. C
Vitamin D
Vit. D
Vitamin A
Vit. A
Vitamin E
Vit. E
Vitamin B1
Vit. B1
Vitamin B2
Vit. B2
Vitamin B3
Vit. B3
Vitamin B5
Vit. B5
Vitamin B6
Vit. B6
Vitamin B12
Vit. B12
Vitamin K
Vit. K
Folate
Folate
2.3%
0%
0%
0%
0%
0%
0%
0.06%
0%
0%
0%
0%
All nutrients comparison - raw data values
Nutrient
DV% diff.
Saturated fat
18.96g
0.013g
86%
Fats
24.85g
0.24g
38%
Copper
0.197mg
0mg
22%
Calories
502kcal
79kcal
21%
Vitamin B2
0.208mg
0mg
16%
Carbs
64.8g
19.23g
15%
Phosphorus
105mg
0mg
15%
Vitamin B12
0.33µg
0µg
14%
Vitamin B1
0.155mg
0mg
13%
Manganese
0.273mg
0mg
12%
Calcium
106mg
0mg
11%
Protein
4.91g
0g
10%
Zinc
1.06mg
0.15mg
8%
Sodium
198mg
7mg
8%
Selenium
4.3µg
0.2µg
7%
Vitamin B3
1.109mg
0mg
7%
Folate
26µg
0µg
7%
Monounsaturated fat
2.988g
0.051g
7%
Magnesium
27mg
1mg
6%
Potassium
186mg
15mg
5%
Vitamin E
0.74mg
0mg
5%
Vitamin B5
0.265mg
0.001mg
5%
Vitamin K
5.6µg
0µg
5%
Fiber
1.1g
0g
4%
Choline
20.9mg
0mg
4%
Polyunsaturated fat
0.628g
0.016g
4%
Iron
0.81mg
0.54mg
3%
Fructose
2.72g
3%
Cholesterol
7mg
0mg
2%
Vitamin A
20µg
0µg
2%
Vitamin B6
0.025mg
0mg
2%
Caffeine
7mg
0mg
2%
Weight per 100 calories
20g
127g
N/A
Unsaturated / Saturated Fat ratio
0.19
5.2
N/A
Vitamin C
0.6mg
0.7mg
0%
Net carbs
63.7g
19.23g
N/A
Sugar
48.25g
13.66g
N/A
Trans fat
0.342g
N/A
Macronutrient Comparison
Macronutrient breakdown side-by-side comparison
4
5%
25%
65%
4%
Protein:
4.91 g
Fats:
24.85 g
Carbs:
64.8 g
Water:
4.23 g
Other:
1.21 g
1
19%
80%
Protein:
0 g
Fats:
0.24 g
Carbs:
19.23 g
Water:
80.49 g
Other:
0.04 g
Contains
more
Protein Protein
+∞%
Contains
more
Fats Fats
+10254.2%
Contains
more
Carbs Carbs
+237%
Contains
more
Other Other
+2925%
Contains
more
Water Water
+1802.8%
Fat Type Comparison
Fat type breakdown side-by-side comparison
2
84%
13%
3%
Saturated fat:
Sat. Fat
18.96 g
Monounsaturated fat:
Mono. Fat
2.988 g
Polyunsaturated fat:
Poly. Fat
0.628 g
1
16%
64%
20%
Saturated fat:
Sat. Fat
0.013 g
Monounsaturated fat:
Mono. Fat
0.051 g
Polyunsaturated fat:
Poly. Fat
0.016 g
Contains
more
Mono. Fat Monounsaturated fat
+5758.8%
Contains
more
Poly. Fat Polyunsaturated fat
+3825%
Contains
less
Sat. Fat Saturated fat
-99.9%