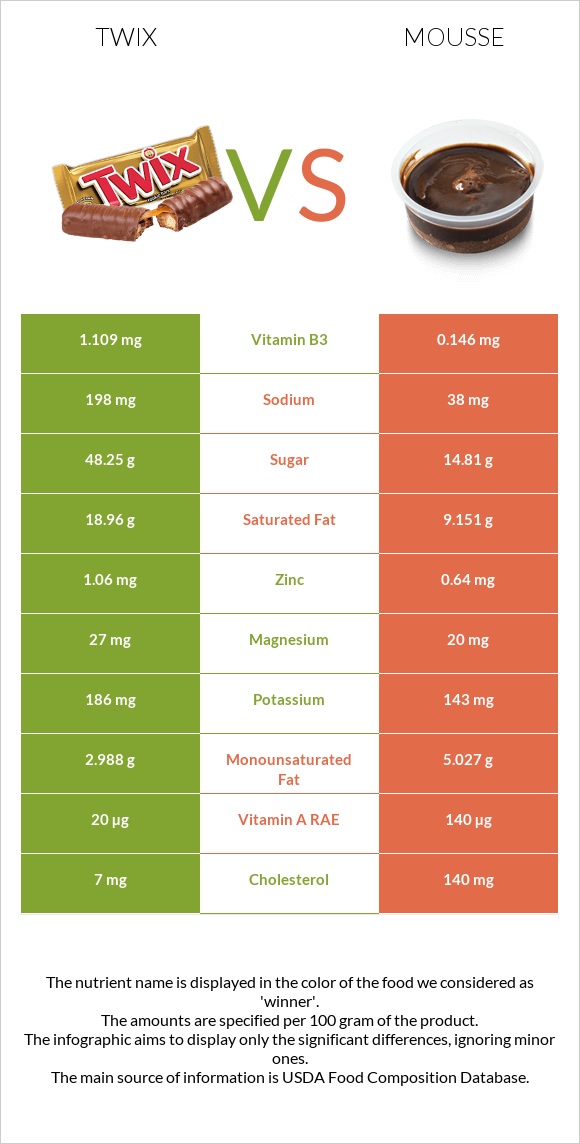
Important differences between Twix and mousse Twix has more copper, manganese, vitamin B1, and vitamin B3; however, mousse is richer in vitamin A, vitamin B12, and selenium. Twix's daily need coverage for saturated fat is 49% more. Twix contains 8 times more vitamin B3 than mousse. Twix contains 1.109mg of vitamin B3, while mousse contains 0.146mg. Mousse contains less sodium. The food varieties used in the comparison are Candies, MARS SNACKFOOD US, TWIX Caramel Cookie Bars and Desserts, mousse, chocolate, prepared-from-recipe .
Infographic
Mineral Comparison
Mineral comparison score is based on the number of minerals by which one or the other food is richer. The "coverage" charts below show how much of the daily needs can be covered by 300 grams of the food.
6
100 g
300 g
1 package (2 oz) - 57g 1 package (2.06 oz, 2 bars) - 58g 1 package, king size (3.35 oz, 4 bars) - 95g 1 package (11 oz) - 312g
Magnesium
Magnesium
Calcium
Calcium
Potassium
Potassium
Iron
Iron
Copper
Copper
Zinc
Zinc
Phosphorus
Phosphorus
Sodium
Sodium
Manganese
Manganese
Selenium
Selenium
19%
32%
16%
30%
66%
29%
45%
26%
36%
23%
3
100 g
300 g
0.5 cup - 202g 1 recipe yield - 808g
Magnesium
Magnesium
Calcium
Calcium
Potassium
Potassium
Iron
Iron
Copper
Copper
Zinc
Zinc
Phosphorus
Phosphorus
Sodium
Sodium
Manganese
Manganese
Selenium
Selenium
14%
29%
13%
21%
25%
17%
50%
5%
7.7%
40%
Vitamin Comparison
Vitamin comparison score is based on the number of vitamins by which one or the other food is richer. The "coverage" charts below show how much of the daily needs can be covered by 300 grams of the food.
6
100 g
300 g
1 package (2 oz) - 57g 1 package (2.06 oz, 2 bars) - 58g 1 package, king size (3.35 oz, 4 bars) - 95g 1 package (11 oz) - 312g
Vitamin C
Vit. C
Vitamin D
Vit. D
Vitamin A
Vit. A
Vitamin E
Vit. E
Vitamin B1
Vit. B1
Vitamin B2
Vit. B2
Vitamin B3
Vit. B3
Vitamin B5
Vit. B5
Vitamin B6
Vit. B6
Vitamin B12
Vit. B12
Vitamin K
Vit. K
Folate
Folate
2%
0%
6.7%
15%
39%
48%
21%
16%
5.8%
41%
14%
20%
4
100 g
300 g
0.5 cup - 202g 1 recipe yield - 808g
Vitamin C
Vit. C
Vitamin D
Vit. D
Vitamin A
Vit. A
Vitamin E
Vit. E
Vitamin B1
Vit. B1
Vitamin B2
Vit. B2
Vitamin B3
Vit. B3
Vitamin B5
Vit. B5
Vitamin B6
Vit. B6
Vitamin B12
Vit. B12
Vitamin K
Vit. K
Folate
Folate
0.33%
0%
47%
10%
11%
47%
2.7%
32%
13%
59%
4%
11%
All nutrients comparison - raw data values
Nutrient
DV% diff.
Saturated fat
18.96g
9.151g
45%
Cholesterol
7mg
140mg
44%
Carbs
64.8g
16.07g
16%
Calories
502kcal
225kcal
14%
Fats
24.85g
16g
14%
Copper
0.197mg
0.075mg
14%
Vitamin A
20µg
140µg
13%
Manganese
0.273mg
0.059mg
9%
Vitamin B1
0.155mg
0.045mg
9%
Sodium
198mg
38mg
7%
Selenium
4.3µg
7.4µg
6%
Vitamin B3
1.109mg
0.146mg
6%
Vitamin B12
0.33µg
0.47µg
6%
Vitamin B5
0.265mg
0.533mg
5%
Monounsaturated fat
2.988g
5.027g
5%
Zinc
1.06mg
0.64mg
4%
Choline
20.9mg
4%
Iron
0.81mg
0.55mg
3%
Vitamin B6
0.025mg
0.058mg
3%
Vitamin K
5.6µg
1.6µg
3%
Folate
26µg
15µg
3%
Protein
4.91g
4.14g
2%
Magnesium
27mg
20mg
2%
Fiber
1.1g
0.6g
2%
Phosphorus
105mg
117mg
2%
Vitamin E
0.74mg
0.51mg
2%
Polyunsaturated fat
0.628g
0.879g
2%
Vitamin C
0.6mg
0.1mg
1%
Calcium
106mg
96mg
1%
Potassium
186mg
143mg
1%
Protein per 100 calories
0.98g
1.8g
N/A
Calories per 10 g protein
1022kcal
543kcal
N/A
Weight per 100 calories
20g
44g
N/A
Unsaturated / Saturated Fat ratio
0.19
0.65
N/A
Net carbs
63.7g
15.47g
N/A
Sugar
48.25g
14.81g
N/A
Vitamin B2
0.208mg
0.205mg
0%
Trans fat
0.342g
N/A
Caffeine
7mg
7mg
0%
Omega-3 - EPA
0g
0.001g
N/A
Omega-3 - DHA
0g
0.01g
N/A
Macronutrient Comparison
Macronutrient breakdown side-by-side comparison
4
5%
25%
65%
4%
Protein:
4.91 g
Fats:
24.85 g
Carbs:
64.8 g
Water:
4.23 g
Other:
1.21 g
1
4%
16%
16%
63%
Protein:
4.14 g
Fats:
16 g
Carbs:
16.07 g
Water:
62.94 g
Other:
0.85 g
Contains
more
Protein Protein
+18.6%
Contains
more
Fats Fats
+55.3%
Contains
more
Carbs Carbs
+303.2%
Contains
more
Other Other
+42.4%
Contains
more
Water Water
+1387.9%
Fat Type Comparison
Fat type breakdown side-by-side comparison
0
84%
13%
3%
Saturated fat:
Sat. Fat
18.96 g
Monounsaturated fat:
Mono. Fat
2.988 g
Polyunsaturated fat:
Poly. Fat
0.628 g
3
61%
33%
6%
Saturated fat:
Sat. Fat
9.151 g
Monounsaturated fat:
Mono. Fat
5.027 g
Polyunsaturated fat:
Poly. Fat
0.879 g
Contains
less
Sat. Fat Saturated fat
-51.7%
Contains
more
Mono. Fat Monounsaturated fat
+68.2%
Contains
more
Poly. Fat Polyunsaturated fat
+40%