Infographic
Mineral Comparison
Mineral comparison score is based on the number of minerals by which one or the other food is richer. The "coverage" charts below show how much of the daily needs can be covered by 300 grams of the food.
1
100 g
300 g
27 pieces - 40g
Magnesium
Magnesium
Calcium
Calcium
Potassium
Potassium
Iron
Iron
Copper
Copper
Zinc
Zinc
Phosphorus
Phosphorus
Sodium
Sodium
Manganese
Manganese
Selenium
Selenium
0%
2.4%
3.3%
11%
0%
0%
10%
25%
0%
0%
9
100 g
300 g
1 piece - 12g
Magnesium
Magnesium
Calcium
Calcium
Potassium
Potassium
Iron
Iron
Copper
Copper
Zinc
Zinc
Phosphorus
Phosphorus
Sodium
Sodium
Manganese
Manganese
Selenium
Selenium
2.9%
10%
4.5%
1.1%
1%
3.3%
14%
18%
0.26%
4.4%
Vitamin Comparison
Vitamin comparison score is based on the number of vitamins by which one or the other food is richer. The "coverage" charts below show how much of the daily needs can be covered by 300 grams of the food.
0
100 g
300 g
27 pieces - 40g
Vitamin C
Vit. C
Vitamin D
Vit. D
Vitamin A
Vit. A
Vitamin E
Vit. E
Vitamin B1
Vit. B1
Vitamin B2
Vit. B2
Vitamin B3
Vit. B3
Vitamin B5
Vit. B5
Vitamin B6
Vit. B6
Vitamin B12
Vit. B12
Vitamin K
Vit. K
Folate
Folate
0%
0%
0%
0%
0%
0%
0%
0%
0%
0%
0%
0%
11
100 g
300 g
1 piece - 12g
Vitamin C
Vit. C
Vitamin D
Vit. D
Vitamin A
Vit. A
Vitamin E
Vit. E
Vitamin B1
Vit. B1
Vitamin B2
Vit. B2
Vitamin B3
Vit. B3
Vitamin B5
Vit. B5
Vitamin B6
Vit. B6
Vitamin B12
Vit. B12
Vitamin K
Vit. K
Folate
Folate
0.67%
0%
106%
19%
2%
16%
0.54%
8%
2.1%
14%
7%
1.5%
All nutrients comparison - raw data values
Nutrient
DV% diff.
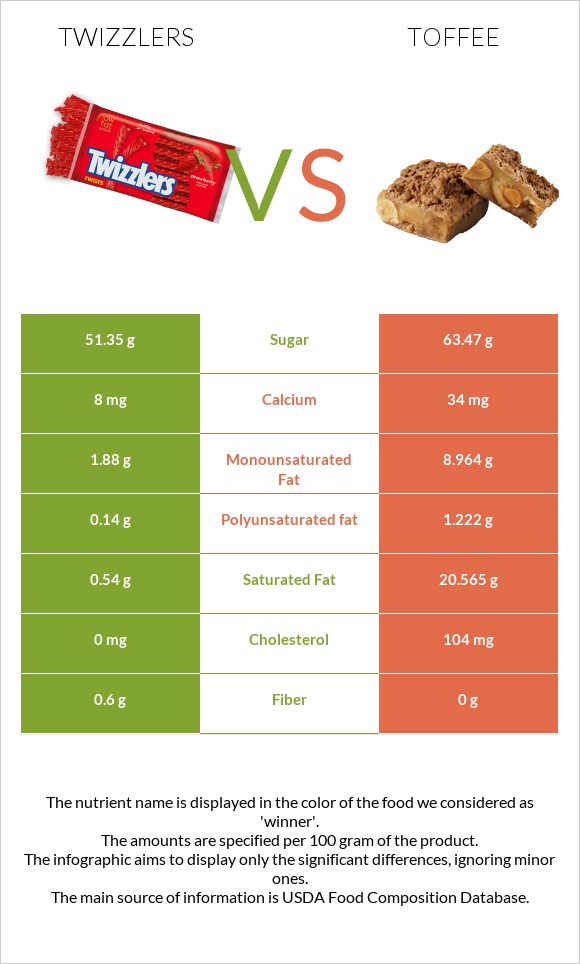
Saturated fat
0.54g
20.565g
91%
Fats
2.64g
32.75g
46%
Cholesterol
0mg
104mg
35%
Vitamin A
319µg
35%
Monounsaturated fat
1.88g
8.964g
18%
Calories
347kcal
560kcal
11%
Polyunsaturated fat
0.14g
1.222g
7%
Vitamin E
0.94mg
6%
Carbs
79.37g
64.72g
5%
Vitamin B2
0.068mg
5%
Vitamin B12
0.11µg
5%
Calcium
8mg
34mg
3%
Iron
0.28mg
0.03mg
3%
Sodium
195mg
135mg
3%
Vitamin B5
0.134mg
3%
Protein
2.3g
1.07g
2%
Fiber
0.6g
0g
2%
Vitamin K
2.8µg
2%
Magnesium
4mg
1%
Zinc
0.12mg
1%
Phosphorus
24mg
32mg
1%
Selenium
0.8µg
1%
Vitamin B1
0.008mg
1%
Vitamin B6
0.009mg
1%
Folate
2µg
1%
Weight per 100 calories
29g
18g
N/A
Unsaturated / Saturated Fat ratio
3.7
0.5
N/A
Vitamin C
0mg
0.2mg
0%
Net carbs
78.77g
64.72g
N/A
Potassium
37mg
51mg
0%
Sugar
51.35g
63.47g
N/A
Copper
0.003mg
0%
Manganese
0.002mg
0%
Vitamin B3
0.029mg
0%
Trans fat
0.674g
N/A
Omega-3 - ALA
0.065g
N/A
Omega-6 - Linoleic acid
0.445g
N/A
Macronutrient Comparison
Macronutrient breakdown side-by-side comparison
3
2%
3%
79%
15%
Protein:
2.3 g
Fats:
2.64 g
Carbs:
79.37 g
Water:
15 g
Other:
0.69 g
2
33%
65%
Protein:
1.07 g
Fats:
32.75 g
Carbs:
64.72 g
Water:
0.55 g
Other:
0.91 g
Contains
more
Protein Protein
+115%
Contains
more
Carbs Carbs
+22.6%
Contains
more
Water Water
+2627.3%
Contains
more
Fats Fats
+1140.5%
Contains
more
Other Other
+31.9%
Fat Type Comparison
Fat type breakdown side-by-side comparison
1
21%
73%
5%
Saturated fat:
Sat. Fat
0.54 g
Monounsaturated fat:
Mono. Fat
1.88 g
Polyunsaturated fat:
Poly. Fat
0.14 g
2
67%
29%
4%
Saturated fat:
Sat. Fat
20.565 g
Monounsaturated fat:
Mono. Fat
8.964 g
Polyunsaturated fat:
Poly. Fat
1.222 g
Contains
less
Sat. Fat Saturated fat
-97.4%
Contains
more
Mono. Fat Monounsaturated fat
+376.8%
Contains
more
Poly. Fat Polyunsaturated fat
+772.9%