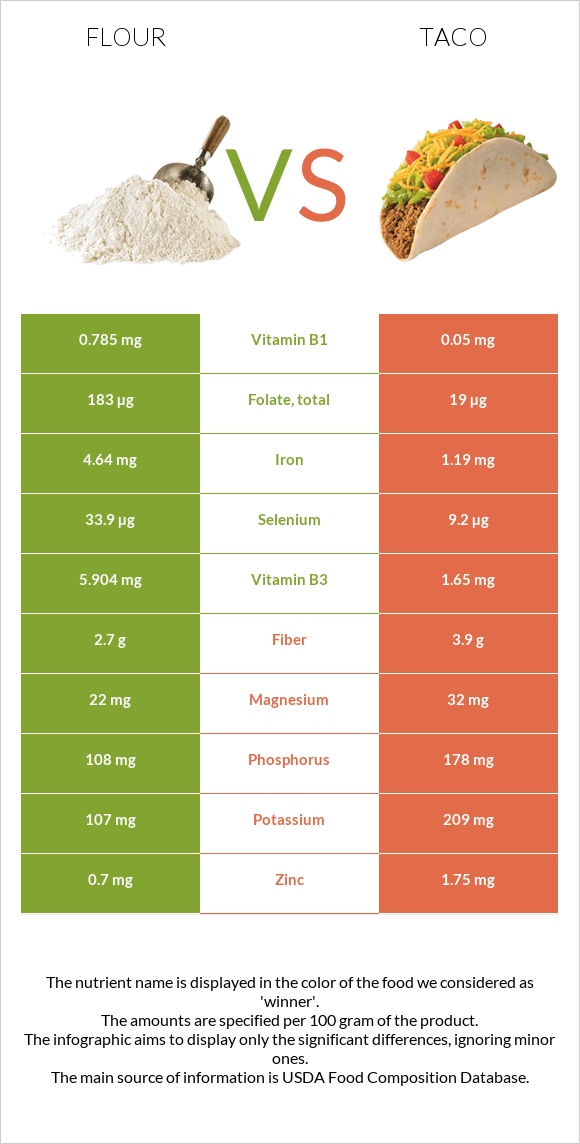
Summary of differences between flour and taco Flour has more vitamin B1, selenium, iron, folate, vitamin B2, vitamin B3, and manganese, while taco has more vitamin B12. Flour covers your daily need for vitamin B1, 61% more than taco. Flour contains 10 times more folate than taco. While flour contains 183µg of folate, taco contains only 19µg. The amount of saturated fat in flour is lower. Taco has a lower glycemic index. The glycemic index of taco is 39, while the glycemic index of flour is 72. These are the specific foods used in this comparison Wheat flour, white, all-purpose, enriched, bleached and Fast foods, taco with beef, cheese, and lettuce, hard shell .
Infographic
Mineral Comparison
Mineral comparison score is based on the number of minerals by which one or the other food is richer. The "coverage" charts below show how much of the daily needs can be covered by 300 grams of the food.
5
100 g
300 g
1 cup - 125g
Magnesium
Magnesium
Calcium
Calcium
Potassium
Potassium
Iron
Iron
Copper
Copper
Zinc
Zinc
Phosphorus
Phosphorus
Sodium
Sodium
Manganese
Manganese
Selenium
Selenium
16%
4.5%
9.4%
174%
48%
19%
46%
0.26%
89%
185%
5
100 g
300 g
1 each taco - 69g
Magnesium
Magnesium
Calcium
Calcium
Potassium
Potassium
Iron
Iron
Copper
Copper
Zinc
Zinc
Phosphorus
Phosphorus
Sodium
Sodium
Manganese
Manganese
Selenium
Selenium
23%
27%
18%
45%
26%
48%
76%
52%
32%
50%
Vitamin Comparison
Vitamin comparison score is based on the number of vitamins by which one or the other food is richer. The "coverage" charts below show how much of the daily needs can be covered by 300 grams of the food.
5
100 g
300 g
1 cup - 125g
Vitamin C
Vit. C
Vitamin D
Vit. D
Vitamin A
Vit. A
Vitamin E
Vit. E
Vitamin B1
Vit. B1
Vitamin B2
Vit. B2
Vitamin B3
Vit. B3
Vitamin B5
Vit. B5
Vitamin B6
Vit. B6
Vitamin B12
Vit. B12
Vitamin K
Vit. K
Folate
Folate
0%
0%
0%
1.2%
196%
114%
111%
26%
10%
0%
0.75%
137%
7
100 g
300 g
1 each taco - 69g
Vitamin C
Vit. C
Vitamin D
Vit. D
Vitamin A
Vit. A
Vitamin E
Vit. E
Vitamin B1
Vit. B1
Vitamin B2
Vit. B2
Vitamin B3
Vit. B3
Vitamin B5
Vit. B5
Vitamin B6
Vit. B6
Vitamin B12
Vit. B12
Vitamin K
Vit. K
Folate
Folate
1.3%
1.5%
6.7%
12%
13%
14%
31%
0%
21%
116%
38%
14%
All nutrients comparison - raw data values
Nutrient
DV% diff.
Vitamin B1
0.785mg
0.05mg
61%
Selenium
33.9µg
9.2µg
45%
Iron
4.64mg
1.19mg
43%
Folate
183µg
19µg
41%
Vitamin B12
0µg
0.93µg
39%
Vitamin B2
0.494mg
0.06mg
33%
Vitamin B3
5.904mg
1.65mg
27%
Carbs
76.31g
19.85g
19%
Manganese
0.682mg
0.249mg
19%
Saturated fat
0.155g
4.384g
19%
Fats
0.98g
12.7g
18%
Polyunsaturated fat
0.413g
3.042g
18%
Sodium
2mg
397mg
17%
Vitamin K
0.3µg
15.3µg
13%
Monounsaturated fat
0.087g
4.411g
11%
Zinc
0.7mg
1.75mg
10%
Phosphorus
108mg
178mg
10%
Cholesterol
0mg
28mg
9%
Vitamin B5
0.438mg
9%
Calories
364kcal
226kcal
7%
Calcium
15mg
89mg
7%
Copper
0.144mg
0.077mg
7%
Starch
14.78g
6%
Fiber
2.7g
3.9g
5%
Vitamin E
0.06mg
0.6mg
4%
Vitamin B6
0.044mg
0.09mg
4%
Choline
10.4mg
32mg
4%
Protein
10.33g
8.86g
3%
Potassium
107mg
209mg
3%
Magnesium
22mg
32mg
2%
Vitamin A
0µg
20µg
2%
Vitamin D*
0 IU
4 IU
1%
Vitamin D
0µg
0.1µg
1%
Protein per 100 calories
2.8g
3.9g
N/A
Calories per 10 g protein
352kcal
255kcal
N/A
Weight per 100 calories
27g
44g
N/A
Unsaturated / Saturated Fat ratio
3.2
1.7
N/A
Vitamin C
0mg
0.4mg
0%
Net carbs
73.61g
15.95g
N/A
Sugar
0.27g
0.9g
N/A
Trans fat
0.467g
N/A
Tryptophan
0.127mg
0%
Threonine
0.281mg
0%
Isoleucine
0.357mg
0%
Leucine
0.71mg
0%
Lysine
0.228mg
0%
Methionine
0.183mg
0%
Phenylalanine
0.52mg
0%
Valine
0.415mg
0%
Histidine
0.23mg
0%
Fructose
0.3g
0%
Omega-3 - EPA
0g
0.005g
N/A
Omega-3 - ALA
0.166g
N/A
Omega-3 - DPA
0g
0.006g
N/A
Omega-3 - Eicosatrienoic acid
0.001g
N/A
Omega-6 - Gamma-linoleic acid
0.002g
N/A
Omega-6 - Dihomo-gamma-linoleic acid
0.011g
N/A
Omega-6 - Eicosadienoic acid
0.004g
N/A
Omega-6 - Linoleic acid
2.708g
N/A
Macronutrient Comparison
Macronutrient breakdown side-by-side comparison
2
10%
76%
12%
Protein:
10.33 g
Fats:
0.98 g
Carbs:
76.31 g
Water:
11.92 g
Other:
0.46 g
3
9%
13%
20%
57%
Protein:
8.86 g
Fats:
12.7 g
Carbs:
19.85 g
Water:
57.02 g
Other:
1.57 g
Contains
more
Protein Protein
+16.6%
Contains
more
Carbs Carbs
+284.4%
Contains
more
Fats Fats
+1195.9%
Contains
more
Water Water
+378.4%
Contains
more
Other Other
+241.3%
Fat Type Comparison
Fat type breakdown side-by-side comparison
1
24%
13%
63%
Saturated fat:
Sat. Fat
0.155 g
Monounsaturated fat:
Mono. Fat
0.087 g
Polyunsaturated fat:
Poly. Fat
0.413 g
2
37%
37%
26%
Saturated fat:
Sat. Fat
4.384 g
Monounsaturated fat:
Mono. Fat
4.411 g
Polyunsaturated fat:
Poly. Fat
3.042 g
Contains
less
Sat. Fat Saturated fat
-96.5%
Contains
more
Mono. Fat Monounsaturated fat
+4970.1%
Contains
more
Poly. Fat Polyunsaturated fat
+636.6%