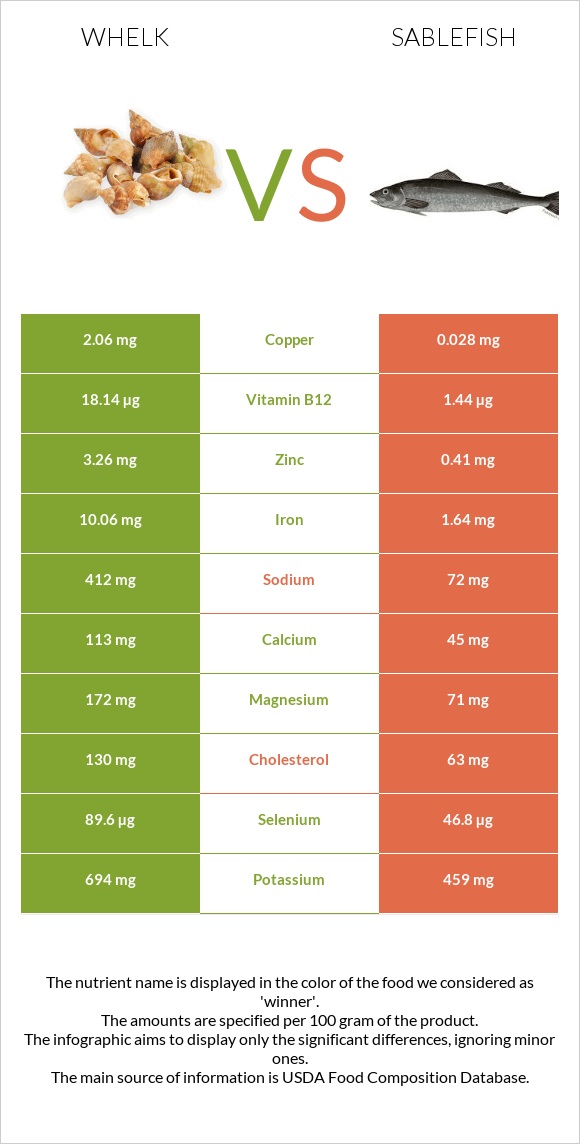
What are the main differences between whelk and sablefish? Whelk has more vitamin B12, copper, iron, selenium, manganese, zinc, magnesium, and vitamin B6 than sablefish. Whelk's daily need coverage for vitamin B12 is 696% higher. Sablefish has 74 times less copper than whelk. Whelk has 2.06mg of copper, while sablefish has 0.028mg. Sablefish is lower in cholesterol. We used Mollusks, whelk, unspecified, cooked, moist heat and Fish, sablefish, cooked, dry heat types in this comparison.
Infographic
Mineral Comparison
Mineral comparison score is based on the number of minerals by which one or the other food is richer. The "coverage" charts below show how much of the daily needs can be covered by 300 grams of the food.
9
100 g
300 g
3 oz - 85g
Magnesium
Magnesium
Calcium
Calcium
Potassium
Potassium
Iron
Iron
Copper
Copper
Zinc
Zinc
Phosphorus
Phosphorus
Sodium
Sodium
Manganese
Manganese
Selenium
Selenium
123%
34%
61%
377%
687%
89%
121%
54%
116%
489%
1
100 g
300 g
3 oz - 85g 0.5 fillet - 151g
Magnesium
Magnesium
Calcium
Calcium
Potassium
Potassium
Iron
Iron
Copper
Copper
Zinc
Zinc
Phosphorus
Phosphorus
Sodium
Sodium
Manganese
Manganese
Selenium
Selenium
51%
14%
41%
62%
9.3%
11%
92%
9.4%
2.5%
255%
Vitamin Comparison
Vitamin comparison score is based on the number of vitamins by which one or the other food is richer. The "coverage" charts below show how much of the daily needs can be covered by 300 grams of the food.
4
100 g
300 g
3 oz - 85g
Vitamin C
Vit. C
Vitamin D
Vit. D
Vitamin A
Vit. A
Vitamin E
Vit. E
Vitamin B1
Vit. B1
Vitamin B2
Vit. B2
Vitamin B3
Vit. B3
Vitamin B5
Vit. B5
Vitamin B6
Vit. B6
Vitamin B12
Vit. B12
Vitamin K
Vit. K
Folate
Folate
23%
0%
16%
0%
12%
49%
37%
24%
150%
2268%
0%
8.3%
5
100 g
300 g
3 oz - 85g 0.5 fillet - 151g
Vitamin C
Vit. C
Vitamin D
Vit. D
Vitamin A
Vit. A
Vitamin E
Vit. E
Vitamin B1
Vit. B1
Vitamin B2
Vit. B2
Vitamin B3
Vit. B3
Vitamin B5
Vit. B5
Vitamin B6
Vit. B6
Vitamin B12
Vit. B12
Vitamin K
Vit. K
Folate
Folate
0%
0%
34%
0%
31%
27%
96%
52%
80%
180%
0%
13%
All nutrients comparison - raw data values
Nutrient
DV% diff.
Vitamin B12
18.14µg
1.44µg
696%
Copper
2.06mg
0.028mg
226%
Iron
10.06mg
1.64mg
105%
Selenium
89.6µg
46.8µg
78%
Protein
47.68g
17.19g
61%
Manganese
0.89mg
0.019mg
38%
Fats
0.8g
19.62g
29%
Zinc
3.26mg
0.41mg
26%
Monounsaturated fat
0.056g
10.328g
26%
Magnesium
172mg
71mg
24%
Vitamin B6
0.65mg
0.346mg
23%
Cholesterol
130mg
63mg
22%
Vitamin B3
1.995mg
5.128mg
20%
Saturated fat
0.062g
4.099g
18%
Polyunsaturated fat
0.046g
2.618g
17%
Sodium
412mg
72mg
15%
Phosphorus
282mg
215mg
10%
Vitamin B5
0.4mg
0.865mg
9%
Vitamin C
6.8mg
0mg
8%
Vitamin B2
0.214mg
0.115mg
8%
Calcium
113mg
45mg
7%
Potassium
694mg
459mg
7%
Vitamin A
49µg
102µg
6%
Vitamin B1
0.049mg
0.122mg
6%
Carbs
15.52g
0g
5%
Folate
11µg
17µg
2%
Calories
275kcal
250kcal
1%
Protein per 100 calories
17g
6.9g
N/A
Calories per 10 g protein
58kcal
145kcal
N/A
Weight per 100 calories
36g
40g
N/A
Unsaturated / Saturated Fat ratio
1.6
3.2
N/A
Net carbs
15.52g
0g
N/A
Tryptophan
0.618mg
0.193mg
0%
Threonine
2.136mg
0.754mg
0%
Isoleucine
1.655mg
0.792mg
0%
Leucine
3.807mg
1.397mg
0%
Lysine
2.93mg
1.579mg
0%
Methionine
1.205mg
0.509mg
0%
Phenylalanine
1.648mg
0.671mg
0%
Valine
2.075mg
0.886mg
0%
Histidine
0.977mg
0.506mg
0%
Omega-3 - EPA
0.008g
0.867g
N/A
Omega-3 - DHA
0.012g
0.92g
N/A
Omega-3 - DPA
0.216g
N/A
Macronutrient Comparison
Macronutrient breakdown side-by-side comparison
3
48%
16%
32%
4%
Protein:
47.68 g
Fats:
0.8 g
Carbs:
15.52 g
Water:
32 g
Other:
4 g
2
17%
20%
63%
Protein:
17.19 g
Fats:
19.62 g
Carbs:
0 g
Water:
62.85 g
Other:
0.34 g
Contains
more
Protein Protein
+177.4%
Contains
more
Carbs Carbs
+∞%
Contains
more
Other Other
+1076.5%
Contains
more
Fats Fats
+2352.5%
Contains
more
Water Water
+96.4%
Fat Type Comparison
Fat type breakdown side-by-side comparison
1
38%
34%
28%
Saturated fat:
Sat. Fat
0.062 g
Monounsaturated fat:
Mono. Fat
0.056 g
Polyunsaturated fat:
Poly. Fat
0.046 g
2
24%
61%
15%
Saturated fat:
Sat. Fat
4.099 g
Monounsaturated fat:
Mono. Fat
10.328 g
Polyunsaturated fat:
Poly. Fat
2.618 g
Contains
less
Sat. Fat Saturated fat
-98.5%
Contains
more
Mono. Fat Monounsaturated fat
+18342.9%
Contains
more
Poly. Fat Polyunsaturated fat
+5591.3%