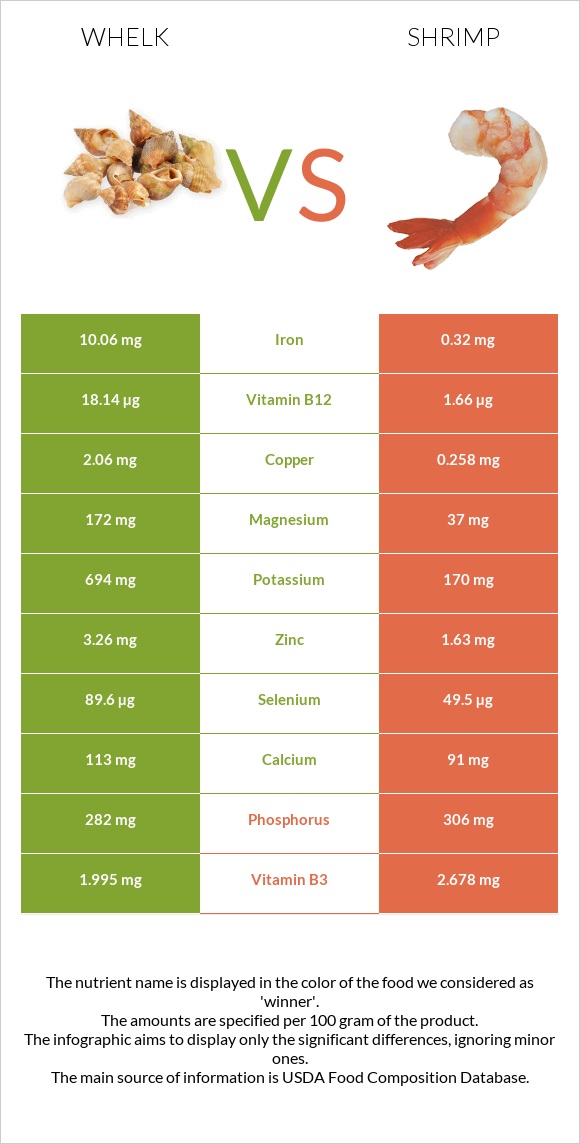
How are whelk and shrimp different? Whelk has more vitamin B12, copper, iron, selenium, manganese, magnesium, vitamin B6, and potassium than shrimp. Daily need coverage for vitamin B12 for whelk is 687% higher. Whelk contains 31 times more iron than shrimp. While whelk contains 10.06mg of iron, shrimp contains only 0.32mg. Whelk has less cholesterol. Mollusks, whelk, unspecified, cooked, moist heat and Crustaceans, shrimp, mixed species, cooked, moist heat (may have been previously frozen) are the varieties used in this article.
Infographic
Mineral Comparison
Mineral comparison score is based on the number of minerals by which one or the other food is richer. The "coverage" charts below show how much of the daily needs can be covered by 300 grams of the food.
9
100 g
300 g
3 oz - 85g
Magnesium
Magnesium
Calcium
Calcium
Potassium
Potassium
Iron
Iron
Copper
Copper
Zinc
Zinc
Phosphorus
Phosphorus
Sodium
Sodium
Manganese
Manganese
Selenium
Selenium
123%
34%
61%
377%
687%
89%
121%
54%
116%
489%
0
100 g
300 g
4 large - 22g 3 oz - 85g
Magnesium
Magnesium
Calcium
Calcium
Potassium
Potassium
Iron
Iron
Copper
Copper
Zinc
Zinc
Phosphorus
Phosphorus
Sodium
Sodium
Manganese
Manganese
Selenium
Selenium
26%
27%
15%
12%
86%
44%
131%
124%
6.4%
270%
Vitamin Comparison
Vitamin comparison score is based on the number of vitamins by which one or the other food is richer. The "coverage" charts below show how much of the daily needs can be covered by 300 grams of the food.
5
100 g
300 g
3 oz - 85g
Vitamin C
Vit. C
Vitamin D
Vit. D
Vitamin A
Vit. A
Vitamin E
Vit. E
Vitamin B1
Vit. B1
Vitamin B2
Vit. B2
Vitamin B3
Vit. B3
Vitamin B5
Vit. B5
Vitamin B6
Vit. B6
Vitamin B12
Vit. B12
Vitamin K
Vit. K
Folate
Folate
23%
0%
16%
0%
12%
49%
37%
24%
150%
2268%
0%
8.3%
7
100 g
300 g
4 large - 22g 3 oz - 85g
Vitamin C
Vit. C
Vitamin D
Vit. D
Vitamin A
Vit. A
Vitamin E
Vit. E
Vitamin B1
Vit. B1
Vitamin B2
Vit. B2
Vitamin B3
Vit. B3
Vitamin B5
Vit. B5
Vitamin B6
Vit. B6
Vitamin B12
Vit. B12
Vitamin K
Vit. K
Folate
Folate
0%
1.5%
30%
44%
8%
5.5%
50%
31%
56%
208%
1%
18%
All nutrients comparison - raw data values
Nutrient
DV% diff.
Vitamin B12
18.14µg
1.66µg
687%
Copper
2.06mg
0.258mg
200%
Iron
10.06mg
0.32mg
122%
Selenium
89.6µg
49.5µg
73%
Protein
47.68g
22.78g
50%
Manganese
0.89mg
0.049mg
37%
Magnesium
172mg
37mg
32%
Vitamin B6
0.65mg
0.242mg
31%
Cholesterol
130mg
211mg
27%
Choline
135.4mg
25%
Sodium
412mg
947mg
23%
Potassium
694mg
170mg
15%
Zinc
3.26mg
1.63mg
15%
Vitamin E
2.2mg
15%
Vitamin B2
0.214mg
0.024mg
15%
Calories
275kcal
119kcal
8%
Vitamin C
6.8mg
0mg
8%
Carbs
15.52g
1.52g
5%
Vitamin A
49µg
90µg
5%
Vitamin B3
1.995mg
2.678mg
4%
Polyunsaturated fat
0.046g
0.59g
4%
Phosphorus
282mg
306mg
3%
Folate
11µg
24µg
3%
Calcium
113mg
91mg
2%
Vitamin B5
0.4mg
0.519mg
2%
Saturated fat
0.062g
0.521g
2%
Fats
0.8g
1.7g
1%
Vitamin D*
4 IU
1%
Vitamin D
0.1µg
1%
Vitamin B1
0.049mg
0.032mg
1%
Monounsaturated fat
0.056g
0.361g
1%
Protein per 100 calories
17g
19g
N/A
Calories per 10 g protein
58kcal
52kcal
N/A
Weight per 100 calories
36g
84g
N/A
Net carbs
15.52g
1.52g
N/A
Vitamin K
0.4µg
0%
Trans fat
0.035g
N/A
Tryptophan
0.618mg
0.26mg
0%
Threonine
2.136mg
0.904mg
0%
Isoleucine
1.655mg
1.05mg
0%
Leucine
3.807mg
1.95mg
0%
Lysine
2.93mg
2.172mg
0%
Methionine
1.205mg
0.665mg
0%
Phenylalanine
1.648mg
0.992mg
0%
Valine
2.075mg
1.067mg
0%
Histidine
0.977mg
0.501mg
0%
Omega-3 - EPA
0.008g
0.135g
N/A
Omega-3 - DHA
0.012g
0.141g
N/A
Omega-3 - DPA
0.012g
N/A
Omega-6 - Eicosadienoic acid
0.012g
N/A
Macronutrient Comparison
Macronutrient breakdown side-by-side comparison
3
48%
16%
32%
4%
Protein:
47.68 g
Fats:
0.8 g
Carbs:
15.52 g
Water:
32 g
Other:
4 g
2
23%
2%
72%
2%
Protein:
22.78 g
Fats:
1.7 g
Carbs:
1.52 g
Water:
71.56 g
Other:
2.44 g
Contains
more
Protein Protein
+109.3%
Contains
more
Carbs Carbs
+921.1%
Contains
more
Other Other
+63.9%
Contains
more
Fats Fats
+112.5%
Contains
more
Water Water
+123.6%
Fat Type Comparison
Fat type breakdown side-by-side comparison
1
38%
34%
28%
Saturated fat:
Sat. Fat
0.062 g
Monounsaturated fat:
Mono. Fat
0.056 g
Polyunsaturated fat:
Poly. Fat
0.046 g
2
35%
25%
40%
Saturated fat:
Sat. Fat
0.521 g
Monounsaturated fat:
Mono. Fat
0.361 g
Polyunsaturated fat:
Poly. Fat
0.59 g
Contains
less
Sat. Fat Saturated fat
-88.1%
Contains
more
Mono. Fat Monounsaturated fat
+544.6%
Contains
more
Poly. Fat Polyunsaturated fat
+1182.6%