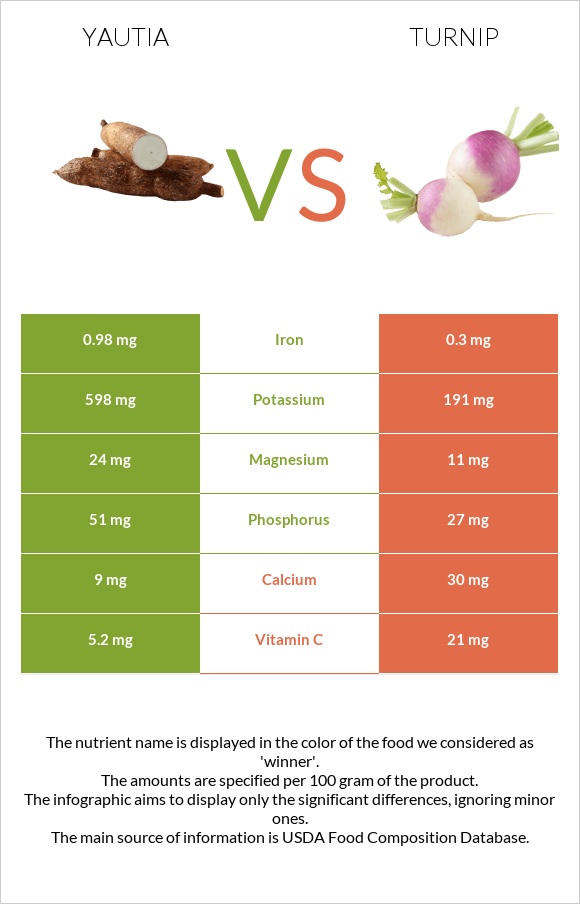
A recap on the differences between yautia and turnip Yautia has more copper, potassium, vitamin B6, and iron; however, turnip is higher in vitamin C. Yautia covers your daily copper needs 19% more than turnip. Turnip contains 3 times less iron than yautia. Yautia contains 0.98mg of iron, while turnip contains 0.3mg. The glycemic index of turnip is higher. Food varieties used in this article are Yautia (tannier), raw and Turnips, raw .
Infographic
Mineral Comparison
Mineral comparison score is based on the number of minerals by which one or the other food is richer. The "coverage" charts below show how much of the daily needs can be covered by 300 grams of the food.
8
100 g
300 g
1 cup, sliced - 135g 1 root - 305g
Magnesium
Magnesium
Calcium
Calcium
Potassium
Potassium
Iron
Iron
Copper
Copper
Zinc
Zinc
Phosphorus
Phosphorus
Sodium
Sodium
Manganese
Manganese
Selenium
Selenium
17%
2.7%
53%
37%
86%
14%
22%
2.7%
24%
3.8%
1
100 g
300 g
1 slice - 15g 1 small - 61g 0.5 cup, cubes - 65g 1 medium - 122g 1 cup, cubes - 130g 1 large - 183g
Magnesium
Magnesium
Calcium
Calcium
Potassium
Potassium
Iron
Iron
Copper
Copper
Zinc
Zinc
Phosphorus
Phosphorus
Sodium
Sodium
Manganese
Manganese
Selenium
Selenium
7.9%
9%
17%
11%
28%
7.4%
12%
8.7%
17%
3.8%
Vitamin Comparison
Vitamin comparison score is based on the number of vitamins by which one or the other food is richer. The "coverage" charts below show how much of the daily needs can be covered by 300 grams of the food.
5
100 g
300 g
1 cup, sliced - 135g 1 root - 305g
Vitamin C
Vit. C
Vitamin D
Vit. D
Vitamin A
Vit. A
Vitamin E
Vit. E
Vitamin B1
Vit. B1
Vitamin B2
Vit. B2
Vitamin B3
Vit. B3
Vitamin B5
Vit. B5
Vitamin B6
Vit. B6
Vitamin B12
Vit. B12
Vitamin K
Vit. K
Folate
Folate
17%
0%
0%
0%
24%
9.2%
13%
13%
55%
0%
0%
13%
3
100 g
300 g
1 slice - 15g 1 small - 61g 0.5 cup, cubes - 65g 1 medium - 122g 1 cup, cubes - 130g 1 large - 183g
Vitamin C
Vit. C
Vitamin D
Vit. D
Vitamin A
Vit. A
Vitamin E
Vit. E
Vitamin B1
Vit. B1
Vitamin B2
Vit. B2
Vitamin B3
Vit. B3
Vitamin B5
Vit. B5
Vitamin B6
Vit. B6
Vitamin B12
Vit. B12
Vitamin K
Vit. K
Folate
Folate
70%
0%
0%
0.6%
10%
6.9%
7.5%
12%
21%
0%
0.25%
11%
All nutrients comparison - raw data values
Nutrient
DV% diff.
Copper
0.257mg
0.085mg
19%
Vitamin C
5.2mg
21mg
18%
Potassium
598mg
191mg
12%
Vitamin B6
0.237mg
0.09mg
11%
Iron
0.98mg
0.3mg
9%
Carbs
23.63g
6.43g
6%
Vitamin B1
0.097mg
0.04mg
5%
Calories
98kcal
28kcal
4%
Magnesium
24mg
11mg
3%
Phosphorus
51mg
27mg
3%
Calcium
9mg
30mg
2%
Zinc
0.5mg
0.27mg
2%
Sodium
21mg
67mg
2%
Manganese
0.186mg
0.134mg
2%
Vitamin B3
0.667mg
0.4mg
2%
Choline
11.1mg
2%
Protein
1.46g
0.9g
1%
Fiber
1.5g
1.8g
1%
Vitamin B2
0.04mg
0.03mg
1%
Folate
17µg
15µg
1%
Protein per 100 calories
1.5g
3.2g
N/A
Calories per 10 g protein
671kcal
311kcal
N/A
Weight per 100 calories
102g
357g
N/A
Fats
0.4g
0.1g
0%
Net carbs
22.13g
4.63g
N/A
Sugar
3.8g
N/A
Vitamin E
0.03mg
0%
Selenium
0.7µg
0.7µg
0%
Vitamin B5
0.209mg
0.2mg
0%
Vitamin K
0.1µg
0%
Saturated fat
0.082g
0.011g
0%
Monounsaturated fat
0.006g
0%
Polyunsaturated fat
0.053g
0%
Tryptophan
0.009mg
0%
Threonine
0.025mg
0%
Isoleucine
0.036mg
0%
Leucine
0.033mg
0%
Lysine
0.036mg
0%
Methionine
0.011mg
0%
Phenylalanine
0.017mg
0%
Valine
0.03mg
0%
Histidine
0.014mg
0%
Macronutrient Comparison
Macronutrient breakdown side-by-side comparison
4
24%
73%
Protein:
1.46 g
Fats:
0.4 g
Carbs:
23.63 g
Water:
73.06 g
Other:
1.45 g
1
6%
92%
Protein:
0.9 g
Fats:
0.1 g
Carbs:
6.43 g
Water:
91.87 g
Other:
0.7 g
Contains
more
Protein Protein
+62.2%
Contains
more
Fats Fats
+300%
Contains
more
Carbs Carbs
+267.5%
Contains
more
Other Other
+107.1%
Contains
more
Water Water
+25.7%
Fat Type Comparison
Fat type breakdown side-by-side comparison
0
100%
Saturated fat:
Sat. Fat
0.082 g
Monounsaturated fat:
Mono. Fat
0 g
Polyunsaturated fat:
Poly. Fat
0 g
3
16%
9%
76%
Saturated fat:
Sat. Fat
0.011 g
Monounsaturated fat:
Mono. Fat
0.006 g
Polyunsaturated fat:
Poly. Fat
0.053 g
Contains
less
Sat. Fat Saturated fat
-86.6%