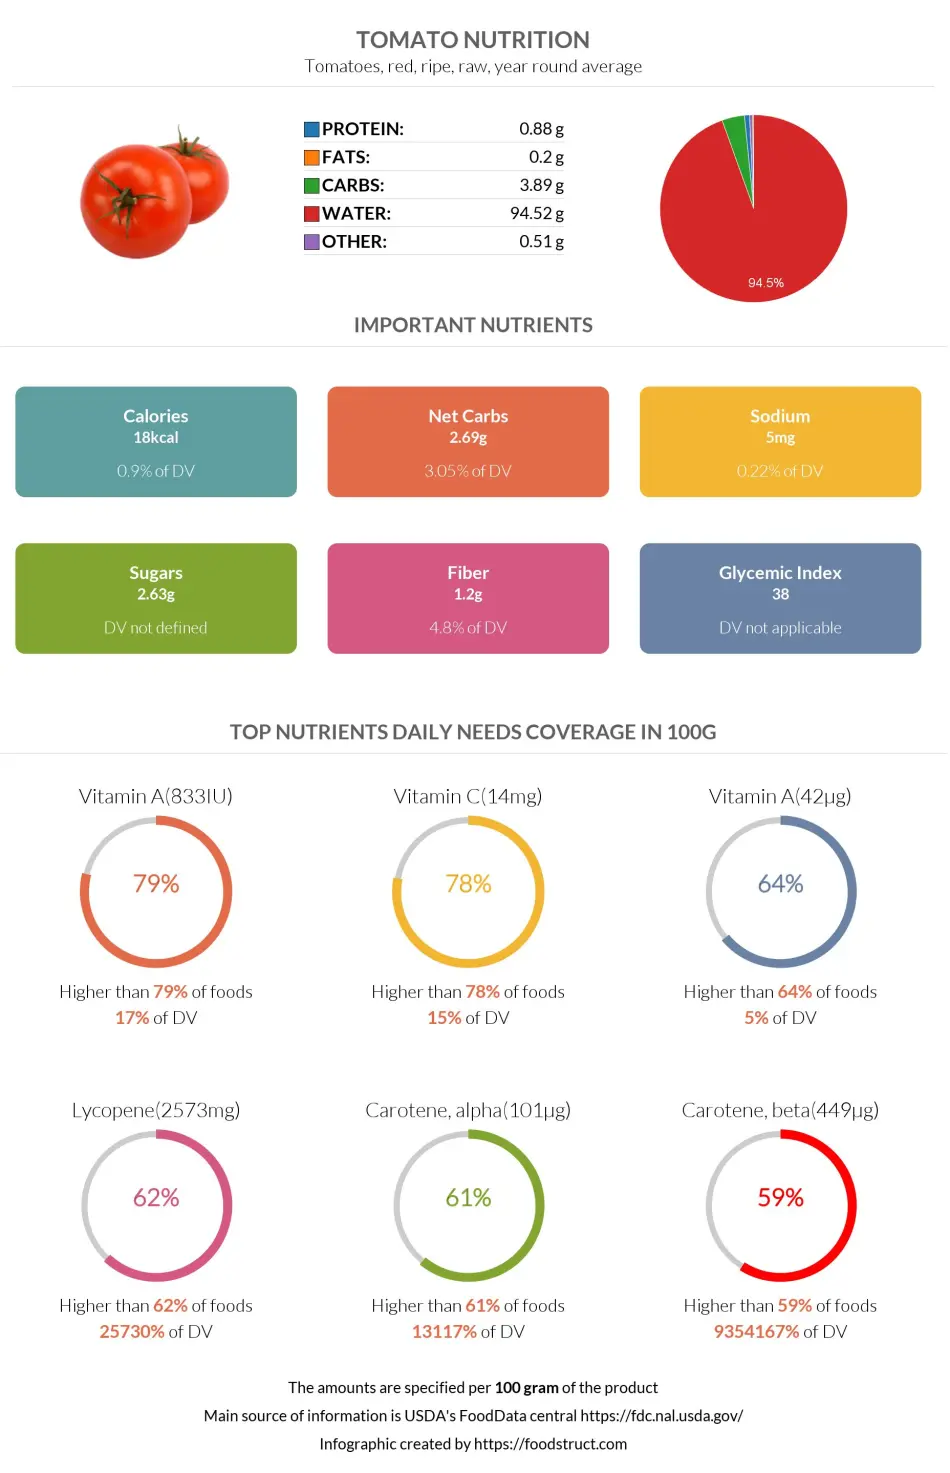
Tomato nutrition: calories, carbs, GI, protein, fiber, fats
Tomatoes, red, ripe, raw, year round average
Medically reviewed by Elen Khachatrian

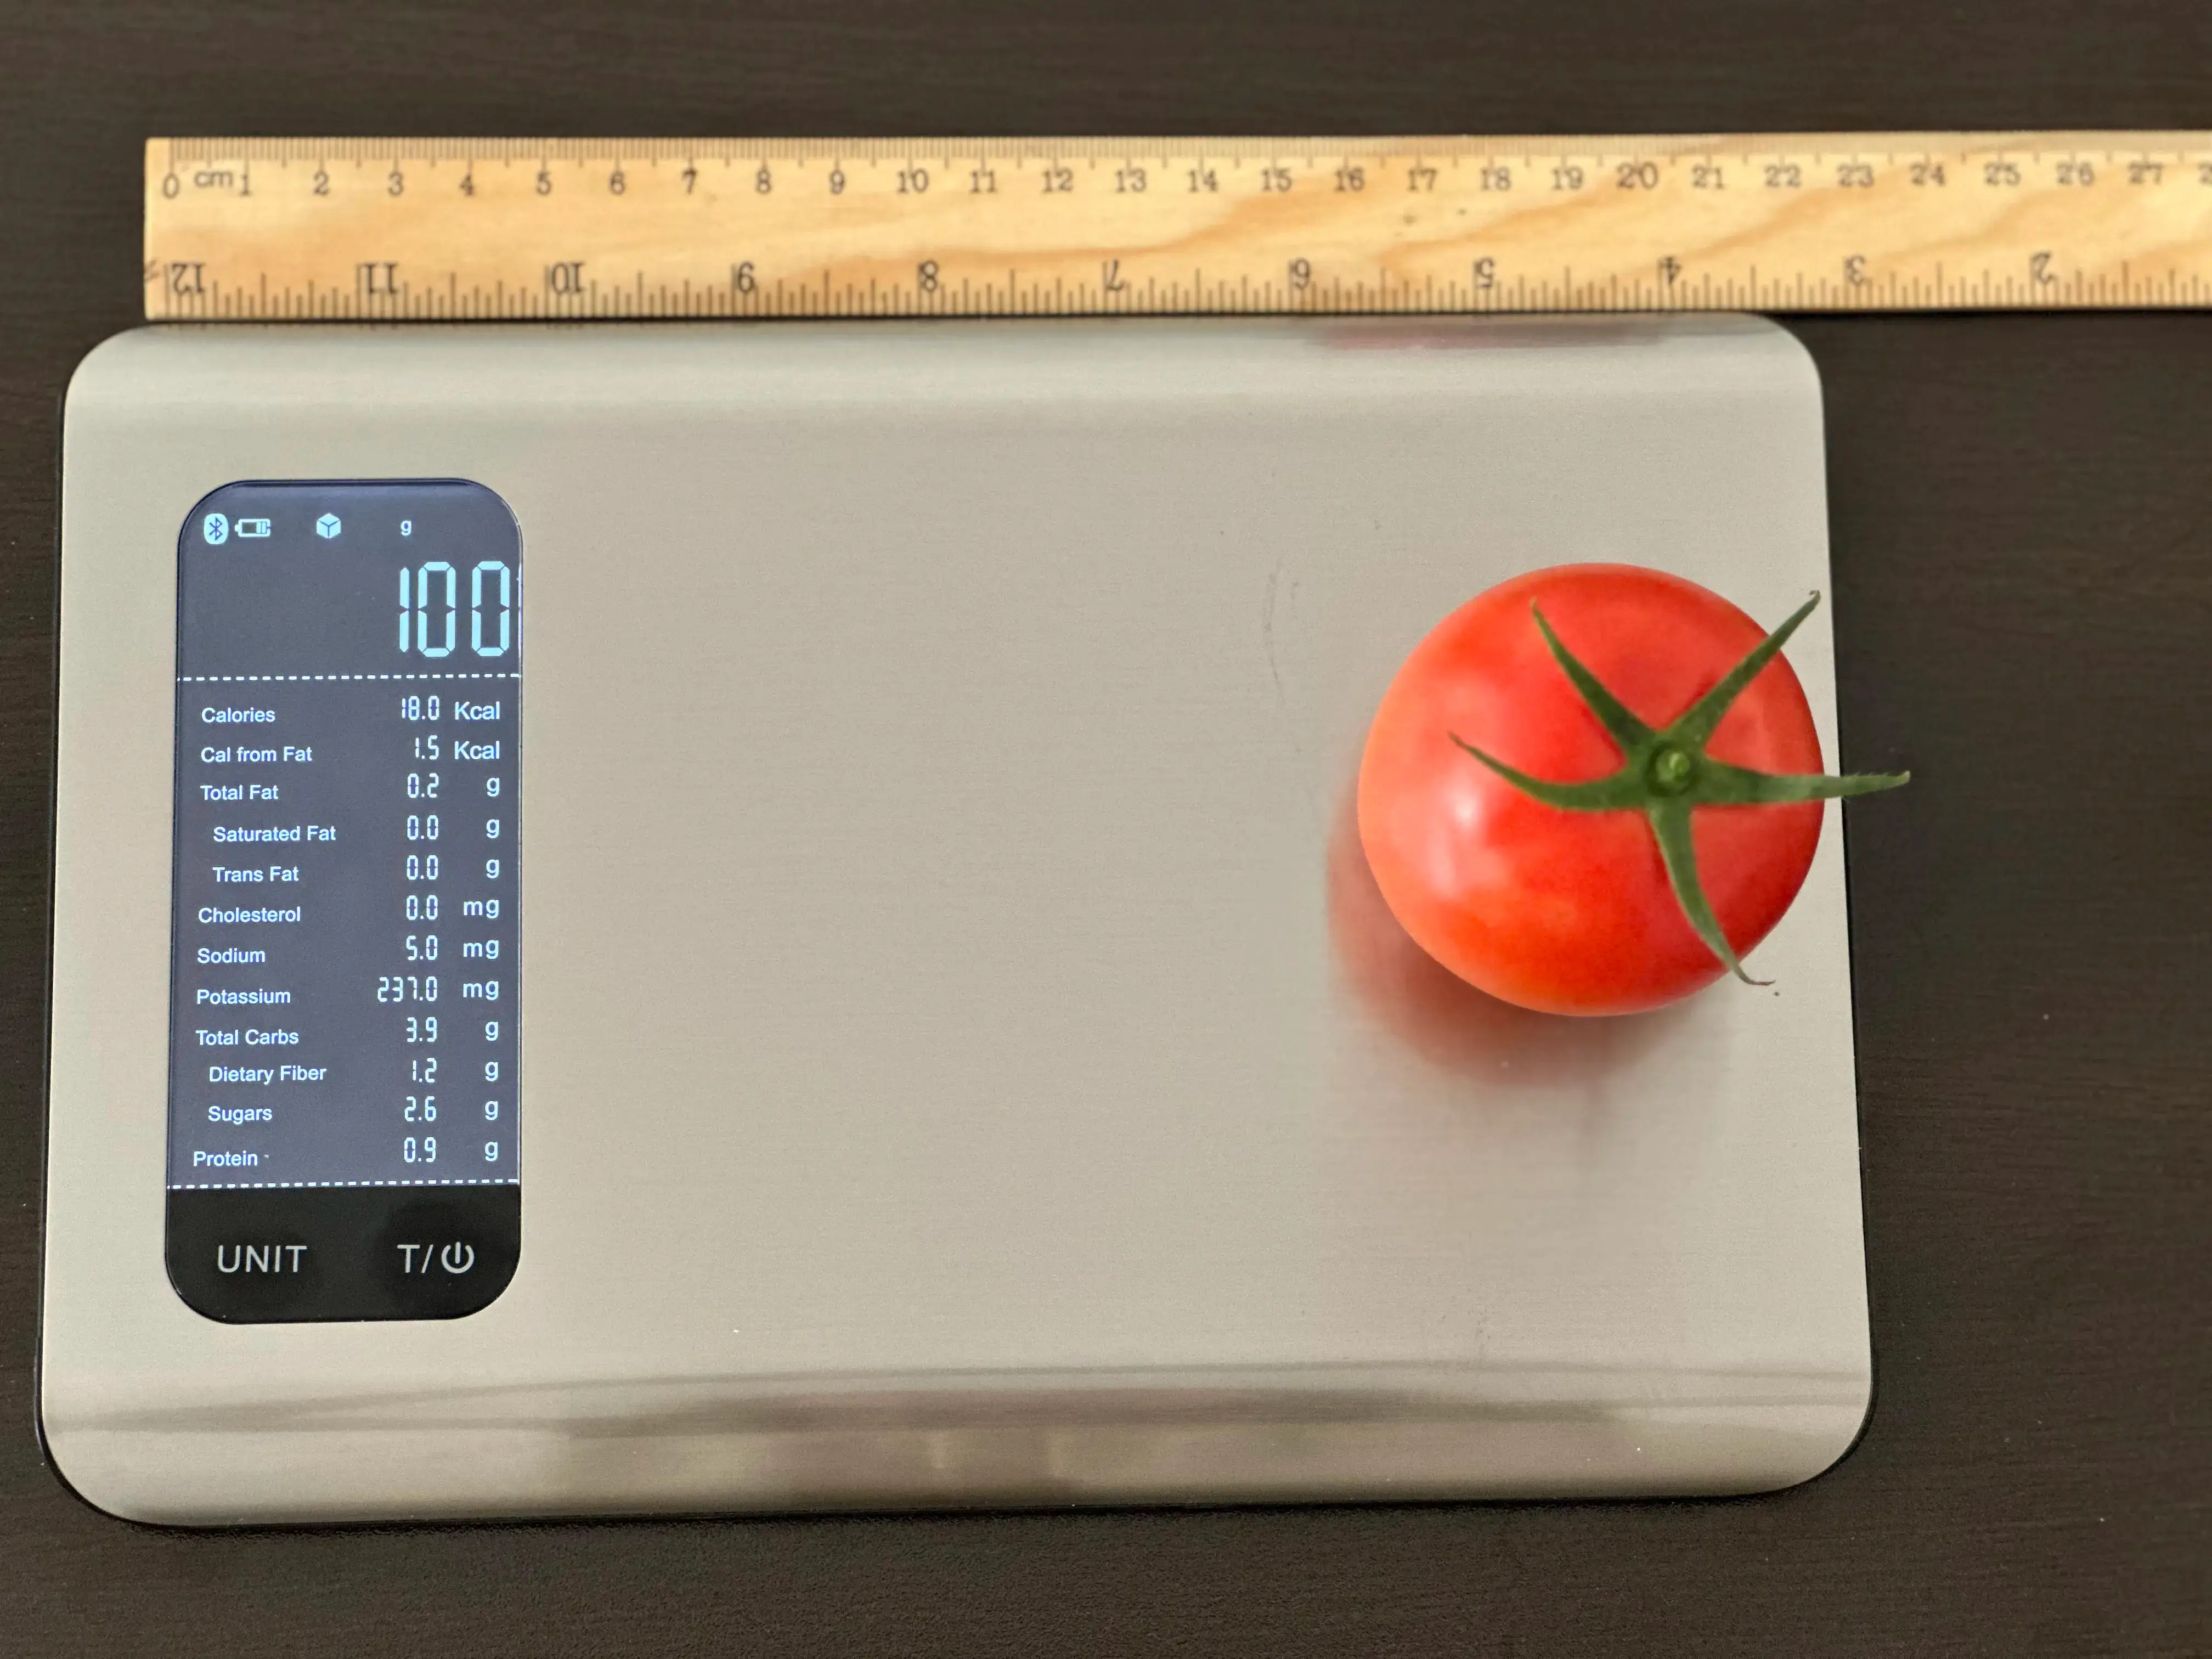
What Does 18 Calories or 100 Grams of Tomato Look Like?
We measured what 100 grams of tomato looks like to help you visualize its weight and calories. As you can see from the picture, one middle-sized tomato made up the entire 100 grams or 18 calories.
Depending on the size of the tomato, the weight and calories may differ for you.

Education: General Medicine at YSMU
Last updated: November 09, 2023
Medically reviewed by Elen Khachatrian
Top nutrition facts for Tomato
| Calories ⓘ Calories for selected serving | 11 kcal |
|
Glycemic index ⓘ
Source: Check out our full article on Tomato glycemic index https://www.sciencedirect.com/science/article/pii/S235261811500027XCheck out our Glycemic index chart page for the full list.
|
23 (low) |
| Glycemic load | 1 (low) |
| Net Carbs ⓘ Net Carbs = Total Carbohydrates – Fiber – Sugar Alcohols | 2 grams |
| Default serving size ⓘ Serving sizes are mostly taken from FDA's Reference Amounts Customarily Consumed (RACCs) | 1 NLEA serving (148 grams) |
| Acidity (Based on PRAL) ⓘ PRAL (Potential renal acid load) is calculated using a formula. On the PRAL scale the higher the positive value, the more is the acidifying effect on the body. The lower the negative value, the higher the alkalinity of the food. 0 is neutral. | -4.1 (alkaline) |
| Oxalates ⓘ https://www.sciencedirect.com/science/article/abs/pii/S0889157513000902 | 3 mg |
Tomato calories (kcal)
| Calroies for different serving sizes of tomato | Calories | Weight |
|---|---|---|
| Calories in 100 grams | 18 | |
| Calories in 1 slice, thin/small | 3 | 15 g |
| Calories in 1 cherry | 3 | 17 g |
| Calories in 1 Italian tomato | 11 | 62 g |
| Calories in 1 plum tomato | 11 | 62 g |
| Calories in 1 NLEA serving | 27 | 148 g |
| Calories in 1 cup cherry tomatoes | 27 | 149 g |
| Calories in 1 cup, chopped or sliced | 32 | 180 g |
| Calories for different varieties of tomato | Calories | Weight |
|---|---|---|
| Tomatoes, red, ripe, raw, year round average (this food) | 18 | 100 g |
| Tomatoes, red, ripe, canned, with green chilies | 15 | 100 g |
| Tomatoes, red, ripe, canned, packed in tomato juice | 16 | 100 g |
| Tomatoes, orange, raw | 16 | 100 g |
| Tomatoes, red, ripe, canned, packed in tomato juice, no salt added | 16 | 100 g |
| Tomatoes, red, ripe, cooked | 18 | 100 g |
| Tomatoes, red, ripe, cooked, with salt | 18 | 100 g |
| Tomatoes, green, raw | 23 | 100 g |
| Tomatoes, red, ripe, canned, stewed | 26 | 100 g |
| Tomatoes, crushed, canned | 32 | 100 g |
| Tomatoes, red, ripe, cooked, stewed | 79 | 100 g |
Tomato Glycemic index (GI)
Source:
Check out our full article on Tomato glycemic index
https://www.sciencedirect.com/science/article/pii/S235261811500027XCheck out our Glycemic index chart page for the full list.
Tomato Glycemic load (GL)
Mineral coverage chart
Mineral chart - relative view
Vitamin coverage chart
Vitamin A:
78µg of 900µg
8.7%
Vitamin E:
1mg of 15mg
6.7%
Vitamin D:
0µg of 20µg
0%
Vitamin C:
25mg of 90mg
28%
Vitamin B1:
0.07mg of 1mg
5.7%
Vitamin B2:
0.04mg of 1mg
2.7%
Vitamin B3:
1.1mg of 16mg
6.9%
Vitamin B5:
0.17mg of 5mg
3.3%
Vitamin B6:
0.15mg of 1mg
11%
Folate:
28µg of 400µg
7%
Vitamin B12:
0µg of 2µg
0%
Choline:
12mg of 550mg
2.3%
Vitamin K:
15µg of 120µg
12%
Vitamin chart - relative view
Macronutrients chart
Protein:
Daily Value: 1%
0.5 g of 50 g
0.5 g (1% of DV )
Fats:
Daily Value: 0%
0.1 g of 65 g
0.1 g (0% of DV )
Carbs:
Daily Value: 1%
2.4 g of 300 g
2.4 g (1% of DV )
Water:
Daily Value: 3%
58.6 g of 2,000 g
58.6 g (3% of DV )
Other:
0.3 g
0.3 g
Protein quality breakdown
Tryptophan:
11mg of 280mg
4%
Threonine:
50mg of 1,050mg
4.8%
Isoleucine:
33mg of 1,400mg
2.4%
Leucine:
47mg of 2,730mg
1.7%
Lysine:
50mg of 2,100mg
2.4%
Methionine:
11mg of 1,050mg
1.1%
Phenylalanine:
50mg of 1,750mg
2.9%
Valine:
33mg of 1,820mg
1.8%
Histidine:
26mg of 700mg
3.7%
Fat type information
Saturated fat:
0.02 g
Monounsaturated fat:
0.02 g
Polyunsaturated fat:
0.05 g
Carbohydrate type breakdown
Starch:
0 g
Sucrose:
0 g
Glucose:
0.78 g
Fructose:
0.85 g
Lactose:
0 g
Maltose:
0 g
Galactose:
0 g
Fiber content ratio for Tomato
Sugar:
1.6 g
Fiber:
0.74 g
Other:
0.04 g
All nutrients for Tomato per selected serving size (1 plum tomato - 62g)
| Nutrient | Value | DV% | In TOP % of foods | Comparison |
| Vitamin A | 26µg | 3% | 36% | |
| Calories | 11kcal | 1% | 98% |
2.6 times less than Orange
|
| Protein | 0.55g | 1% | 86% |
3.2 times less than Broccoli
|
| Fats | 0.12g | 0% | 88% |
166.6 times less than Cheese
|
| Vitamin C | 8.5mg | 9% | 22% |
3.9 times less than Lemon
|
| Net carbs | 1.7g | N/A | 64% |
20.1 times less than Chocolate
|
| Carbs | 2.4g | 1% | 63% |
7.2 times less than Rice
|
| Cholesterol | 0mg | 0% | 100% |
N/A
|
| Vitamin D | 0µg | 0% | 100% |
N/A
|
| Magnesium | 6.8mg | 2% | 82% |
12.7 times less than Almonds
|
| Calcium | 6.2mg | 1% | 76% |
12.5 times less than Milk
|
| Potassium | 147mg | 4% | 51% |
1.6 times more than Cucumber
|
| Iron | 0.17mg | 2% | 86% |
9.6 times less than Beef broiled
|
| Sugar | 1.6g | N/A | 57% |
3.4 times less than Coca-Cola
|
| Fiber | 0.74g | 3% | 47% |
2 times less than Orange
|
| Copper | 0.04mg | 4% | 76% |
2.4 times less than Shiitake
|
| Zinc | 0.11mg | 1% | 87% |
37.1 times less than Beef broiled
|
| Starch | 0g | 0% | 100% |
N/A
|
| Phosphorus | 15mg | 2% | 87% |
7.6 times less than Chicken meat
|
| Sodium | 3.1mg | 0% | 90% |
98 times less than White bread
|
| Vitamin E | 0.33mg | 2% | 55% |
2.7 times less than Kiwi
|
| Selenium | 0µg | 0% | 100% | |
| Manganese | 0.07mg | 3% | 59% | |
| Vitamin B1 | 0.02mg | 2% | 79% |
7.2 times less than Pea raw
|
| Vitamin B2 | 0.01mg | 1% | 92% |
6.8 times less than Avocado
|
| Vitamin B3 | 0.37mg | 2% | 76% |
16.1 times less than Turkey meat
|
| Vitamin B5 | 0.06mg | 1% | 90% |
12.7 times less than Sunflower seeds
|
| Vitamin B6 | 0.05mg | 4% | 70% |
1.5 times less than Oats
|
| Vitamin B12 | 0µg | 0% | 100% |
N/A
|
| Vitamin K | 4.9µg | 4% | 52% |
12.9 times less than Broccoli
|
| Trans fat | 0g | N/A | 100% |
N/A
|
| Folate | 9.3µg | 2% | 53% |
4.1 times less than Brussels sprouts
|
| Saturated fat | 0.02g | 0% | 89% |
210.5 times less than Beef broiled
|
| Choline | 4.2mg | 1% | 89% | |
| Monounsaturated fat | 0.02g | N/A | 87% |
316.1 times less than Avocado
|
| Polyunsaturated fat | 0.05g | N/A | 87% |
568.4 times less than Walnut
|
| Tryptophan | 0mg | 0% | 97% |
50.8 times less than Chicken meat
|
| Threonine | 0.02mg | 0% | 96% |
26.7 times less than Beef broiled
|
| Isoleucine | 0.01mg | 0% | 97% |
50.8 times less than Salmon raw
|
| Leucine | 0.02mg | 0% | 97% |
97.2 times less than Tuna Bluefin
|
| Lysine | 0.02mg | 0% | 97% |
16.7 times less than Tofu
|
| Methionine | 0mg | 0% | 97% |
16 times less than Quinoa
|
| Phenylalanine | 0.02mg | 0% | 96% |
24.7 times less than Egg
|
| Valine | 0.01mg | 0% | 97% |
112.7 times less than Soybean raw
|
| Histidine | 0.01mg | 0% | 96% |
53.5 times less than Turkey meat
|
| Fructose | 0.85g | 1% | 85% |
4.3 times less than Apple
|
| Caffeine | 0mg | 0% | 100% | |
| Omega-3 - EPA | 0g | N/A | 100% |
N/A
|
| Omega-3 - DHA | 0g | N/A | 100% |
N/A
|
| Omega-3 - DPA | 0g | N/A | 100% |
N/A
|
Check out similar food or compare with current
NUTRITION FACTS LABEL
Nutrition Facts
___servings per container
Serving Size ______________
Serving Size ______________
Amount Per 100g
Calories 11
% Daily Value*
0.19%
Total Fat
0.12g
0.08%
Saturated Fat 0.02g
0
Trans Fat
0g
0
Cholesterol 0mg
0.13%
Sodium 3.1mg
0.8%
Total Carbohydrate
2.4g
3%
Dietary Fiber
0.74g
Total Sugars 0g
Includes ? g Added Sugars
Protein
0.55g
Vitamin D
0mcg
0
Calcium
6.2mg
0.62%
Iron
0.17mg
2.1%
Potassium
147mg
4.3%
*
The % Daily Value (DV) tells you how much a nutrient in a serving of food contributes to a daily diet. 2,000 calories a day is used for general nutrition advice.
Health checks
ⓘ
Dietary cholesterol is not associated with an increased risk of coronary heart disease in healthy individuals. However, dietary cholesterol is common in foods that are high in harmful saturated fats.
Source
Low in Cholesterol
ⓘ
Trans fat consumption increases the risk of cardiovascular disease and mortality by negatively affecting blood lipid levels.
Source
No Trans Fats
ⓘ
Saturated fat intake can raise total cholesterol and LDL (low-density lipoprotein) levels, leading to an increased risk of atherosclerosis. Dietary guidelines recommend limiting saturated fats to under 10% of calories a day.
Source
Low in Saturated Fats
ⓘ
While the consumption of moderate amounts of added sugars is not detrimental to health, an excessive intake can increase the risk of obesity, and therefore, diabetes.
Source
Low in Sugars
Tomato nutrition infographic
Infographic link
References
All the values for which the sources are not specified explicitly are taken from FDA’s Food Central. The exact link to the food presented on this page can be found below.