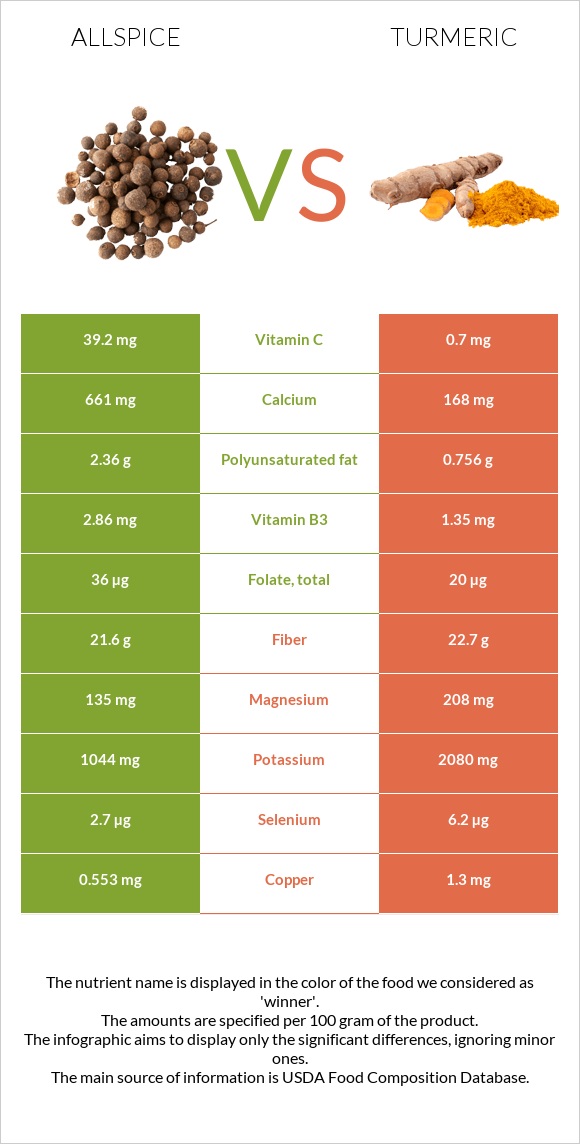
The main differences between allspice and turmeric Allspice has more calcium, vitamin C, and vitamin A; however, turmeric has more manganese, iron, copper, zinc, potassium, phosphorus, and magnesium. Daily need coverage for manganese for turmeric is 733% higher. Allspice has a higher glycemic index than turmeric. Food types used in this article are Spices, allspice, ground and Spices, turmeric, ground .
Infographic
Mineral Comparison
Mineral comparison score is based on the number of minerals by which one or the other food is richer. The "coverage" charts below show how much of the daily needs can be covered by 300 grams of the food.
1
100 g
300 g
0.25 tsp - 0.5g 1 tsp - 1.9g 1 tbsp - 6g
Magnesium
Magnesium
Calcium
Calcium
Potassium
Potassium
Iron
Iron
Copper
Copper
Zinc
Zinc
Phosphorus
Phosphorus
Sodium
Sodium
Manganese
Manganese
Selenium
Selenium
96%
198%
92%
265%
184%
28%
48%
10%
384%
15%
9
100 g
300 g
0.25 tsp - 0.5g 1 tbsp - 9.4g
Magnesium
Magnesium
Calcium
Calcium
Potassium
Potassium
Iron
Iron
Copper
Copper
Zinc
Zinc
Phosphorus
Phosphorus
Sodium
Sodium
Manganese
Manganese
Selenium
Selenium
149%
50%
184%
2063%
433%
123%
128%
3.5%
2583%
34%
Vitamin Comparison
Vitamin comparison score is based on the number of vitamins by which one or the other food is richer. The "coverage" charts below show how much of the daily needs can be covered by 300 grams of the food.
6
100 g
300 g
0.25 tsp - 0.5g 1 tsp - 1.9g 1 tbsp - 6g
Vitamin C
Vit. C
Vitamin D
Vit. D
Vitamin A
Vit. A
Vitamin E
Vit. E
Vitamin B1
Vit. B1
Vitamin B2
Vit. B2
Vitamin B3
Vit. B3
Vitamin B5
Vit. B5
Vitamin B6
Vit. B6
Vitamin B12
Vit. B12
Vitamin K
Vit. K
Folate
Folate
131%
0%
9%
0%
25%
15%
54%
0%
48%
0%
0%
27%
4
100 g
300 g
0.25 tsp - 0.5g 1 tbsp - 9.4g
Vitamin C
Vit. C
Vitamin D
Vit. D
Vitamin A
Vit. A
Vitamin E
Vit. E
Vitamin B1
Vit. B1
Vitamin B2
Vit. B2
Vitamin B3
Vit. B3
Vitamin B5
Vit. B5
Vitamin B6
Vit. B6
Vitamin B12
Vit. B12
Vitamin K
Vit. K
Folate
Folate
2.3%
0%
0%
89%
15%
35%
25%
33%
25%
0%
34%
15%
All nutrients comparison - raw data values
Nutrient
DV% diff.
Manganese
2.943mg
19.8mg
733%
Iron
7.06mg
55mg
599%
Copper
0.553mg
1.3mg
83%
Calcium
661mg
168mg
49%
Vitamin C
39.2mg
0.7mg
43%
Zinc
1.01mg
4.5mg
32%
Potassium
1044mg
2080mg
30%
Vitamin E
4.43mg
30%
Phosphorus
113mg
299mg
27%
Magnesium
135mg
208mg
17%
Vitamin B5
0.542mg
11%
Vitamin K
13.4µg
11%
Polyunsaturated fat
2.36g
0.756g
11%
Vitamin B3
2.86mg
1.35mg
9%
Choline
49.2mg
9%
Fats
8.69g
3.25g
8%
Vitamin B6
0.21mg
0.107mg
8%
Protein
6.09g
9.68g
7%
Vitamin B2
0.063mg
0.15mg
7%
Selenium
2.7µg
6.2µg
6%
Fiber
21.6g
22.7g
4%
Vitamin B1
0.101mg
0.058mg
4%
Folate
36µg
20µg
4%
Vitamin A
27µg
0µg
3%
Saturated fat
2.55g
1.838g
3%
Calories
263kcal
312kcal
2%
Carbs
72.12g
67.14g
2%
Sodium
77mg
27mg
2%
Monounsaturated fat
0.66g
0.449g
1%
Fructose
0.45g
1%
Protein per 100 calories
2.3g
3.1g
N/A
Calories per 10 g protein
432kcal
322kcal
N/A
Weight per 100 calories
38g
32g
N/A
Unsaturated / Saturated Fat ratio
1.2
0.66
N/A
Net carbs
50.52g
44.44g
N/A
Sugar
3.21g
N/A
Trans fat
0g
0.056g
N/A
Tryptophan
0.17mg
0%
Threonine
0.33mg
0%
Isoleucine
0.47mg
0%
Leucine
0.81mg
0%
Lysine
0.38mg
0%
Methionine
0.14mg
0%
Phenylalanine
0.53mg
0%
Valine
0.66mg
0%
Histidine
0.15mg
0%
Omega-3 - ALA
0.003g
N/A
Omega-6 - Gamma-linoleic acid
0.081g
N/A
Macronutrient Comparison
Macronutrient breakdown side-by-side comparison
2
6%
9%
72%
8%
5%
Protein:
6.09 g
Fats:
8.69 g
Carbs:
72.12 g
Water:
8.46 g
Other:
4.64 g
3
10%
3%
67%
13%
7%
Protein:
9.68 g
Fats:
3.25 g
Carbs:
67.14 g
Water:
12.85 g
Other:
7.08 g
Contains
more
Fats Fats
+167.4%
Contains
more
Protein Protein
+58.9%
Contains
more
Water Water
+51.9%
Contains
more
Other Other
+52.6%
Fat Type Comparison
Fat type breakdown side-by-side comparison
2
46%
12%
42%
Saturated fat:
Sat. Fat
2.55 g
Monounsaturated fat:
Mono. Fat
0.66 g
Polyunsaturated fat:
Poly. Fat
2.36 g
1
60%
15%
25%
Saturated fat:
Sat. Fat
1.838 g
Monounsaturated fat:
Mono. Fat
0.449 g
Polyunsaturated fat:
Poly. Fat
0.756 g
Contains
more
Mono. Fat Monounsaturated fat
+47%
Contains
more
Poly. Fat Polyunsaturated fat
+212.2%
Contains
less
Sat. Fat Saturated fat
-27.9%