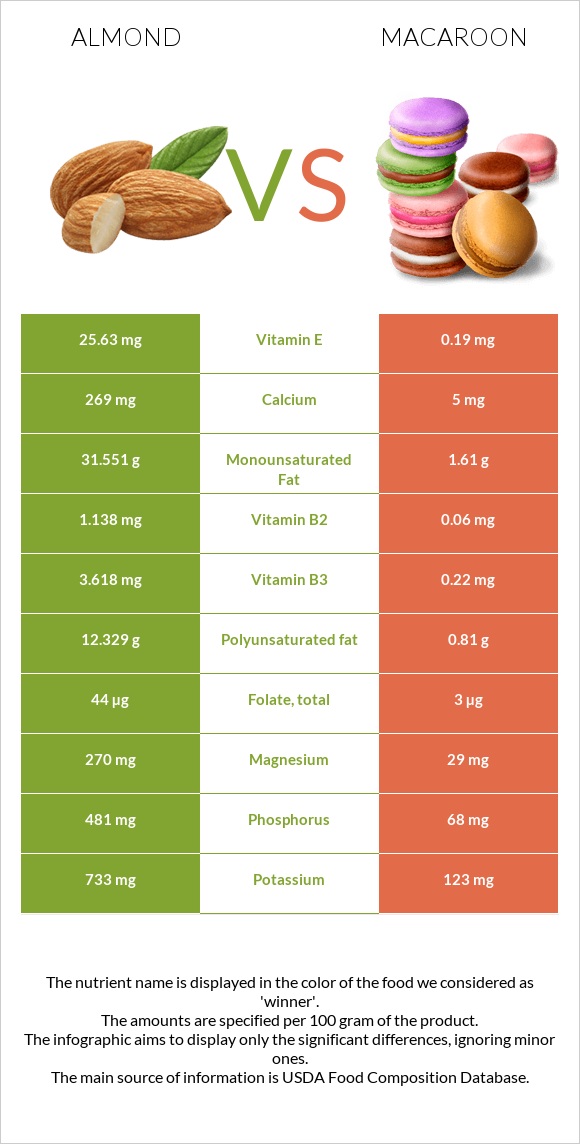
Significant differences between almonds and macaroon The amount of vitamin E, copper, vitamin B2, phosphorus, magnesium, iron, fiber, calcium, and zinc in almonds is higher than in macaroon. Almonds cover your daily vitamin E needs 170% more than macaroon. Macaroon has 54 times less calcium than almonds. Almonds have 269mg of calcium, while macaroon has 5mg. Almonds contain less saturated fat. Macaroon has a higher glycemic index. The glycemic index of macaroon is 32, while the glycemic index of almonds is 0. Specific food types used in this comparison are Nuts, almonds and Cookies, coconut macaroon .
Infographic
Mineral Comparison
Mineral comparison score is based on the number of minerals by which one or the other food is richer. The "coverage" charts below show how much of the daily needs can be covered by 300 grams of the food.
9
100 g
300 g
1 almond - 1.2g 1 oz (23 whole kernels) - 28.35g 1 cup, sliced - 92g 1 cup, ground - 95g 1 cup, slivered - 108g 1 cup, whole - 143g
Magnesium
Magnesium
Calcium
Calcium
Potassium
Potassium
Iron
Iron
Copper
Copper
Zinc
Zinc
Phosphorus
Phosphorus
Sodium
Sodium
Manganese
Manganese
Selenium
Selenium
193%
81%
65%
139%
344%
85%
206%
0.13%
284%
22%
1
100 g
300 g
2 cookie 1 serving - 36g
Magnesium
Magnesium
Calcium
Calcium
Potassium
Potassium
Iron
Iron
Copper
Copper
Zinc
Zinc
Phosphorus
Phosphorus
Sodium
Sodium
Manganese
Manganese
Selenium
Selenium
21%
1.5%
11%
31%
90%
20%
29%
31%
0%
37%
Vitamin Comparison
Vitamin comparison score is based on the number of vitamins by which one or the other food is richer. The "coverage" charts below show how much of the daily needs can be covered by 300 grams of the food.
7
100 g
300 g
1 almond - 1.2g 1 oz (23 whole kernels) - 28.35g 1 cup, sliced - 92g 1 cup, ground - 95g 1 cup, slivered - 108g 1 cup, whole - 143g
Vitamin C
Vit. C
Vitamin D
Vit. D
Vitamin A
Vit. A
Vitamin E
Vit. E
Vitamin B1
Vit. B1
Vitamin B2
Vit. B2
Vitamin B3
Vit. B3
Vitamin B5
Vit. B5
Vitamin B6
Vit. B6
Vitamin B12
Vit. B12
Vitamin K
Vit. K
Folate
Folate
0%
0%
0%
513%
51%
263%
68%
28%
32%
0%
0%
33%
1
100 g
300 g
2 cookie 1 serving - 36g
Vitamin C
Vit. C
Vitamin D
Vit. D
Vitamin A
Vit. A
Vitamin E
Vit. E
Vitamin B1
Vit. B1
Vitamin B2
Vit. B2
Vitamin B3
Vit. B3
Vitamin B5
Vit. B5
Vitamin B6
Vit. B6
Vitamin B12
Vit. B12
Vitamin K
Vit. K
Folate
Folate
0%
0%
0%
3.8%
5%
14%
4.1%
0%
22%
0%
2.8%
2.3%
All nutrients comparison - raw data values
Nutrient
DV% diff.
Vitamin E
25.63mg
0.19mg
170%
Manganese
2.179mg
95%
Copper
1.031mg
0.269mg
85%
Vitamin B2
1.138mg
0.06mg
83%
Polyunsaturated fat
12.329g
0.81g
77%
Monounsaturated fat
31.551g
1.61g
75%
Saturated fat
3.802g
20.099g
74%
Phosphorus
481mg
68mg
59%
Magnesium
270mg
29mg
57%
Fats
49.93g
22.55g
42%
Protein
21.15g
3.02g
36%
Iron
3.71mg
0.82mg
36%
Fiber
12.5g
5.1g
30%
Calcium
269mg
5mg
26%
Zinc
3.12mg
0.73mg
22%
Vitamin B3
3.618mg
0.22mg
21%
Potassium
733mg
123mg
18%
Vitamin B1
0.205mg
0.02mg
15%
Carbs
21.55g
61.22g
13%
Sodium
1mg
241mg
10%
Folate
44µg
3µg
10%
Vitamin B5
0.471mg
9%
Choline
52.1mg
9.1mg
8%
Calories
579kcal
460kcal
6%
Selenium
4.1µg
6.8µg
5%
Vitamin B6
0.137mg
0.096mg
3%
Vitamin K
0µg
1.1µg
1%
Protein per 100 calories
3.7g
0.66g
N/A
Calories per 10 g protein
274kcal
1523kcal
N/A
Weight per 100 calories
17g
22g
N/A
Unsaturated / Saturated Fat ratio
12
0.12
N/A
Net carbs
9.05g
56.12g
N/A
Sugar
4.35g
45.16g
N/A
Starch
0.72g
0%
Trans fat
0.015g
N/A
Tryptophan
0.211mg
0%
Threonine
0.601mg
0%
Isoleucine
0.751mg
0%
Leucine
1.473mg
0%
Lysine
0.568mg
0%
Methionine
0.157mg
0%
Phenylalanine
1.132mg
0%
Valine
0.855mg
0%
Histidine
0.539mg
0%
Fructose
0.11g
0%
Omega-3 - ALA
0.003g
N/A
Omega-6 - Eicosadienoic acid
0.002g
N/A
Omega-6 - Linoleic acid
12.32g
N/A
Macronutrient Comparison
Macronutrient breakdown side-by-side comparison
3
21%
50%
22%
4%
3%
Protein:
21.15 g
Fats:
49.93 g
Carbs:
21.55 g
Water:
4.41 g
Other:
2.96 g
2
3%
23%
61%
12%
2%
Protein:
3.02 g
Fats:
22.55 g
Carbs:
61.22 g
Water:
11.5 g
Other:
1.71 g
Contains
more
Protein Protein
+600.3%
Contains
more
Fats Fats
+121.4%
Contains
more
Other Other
+73.1%
Contains
more
Carbs Carbs
+184.1%
Contains
more
Water Water
+160.8%
Fat Type Comparison
Fat type breakdown side-by-side comparison
3
8%
66%
26%
Saturated fat:
Sat. Fat
3.802 g
Monounsaturated fat:
Mono. Fat
31.551 g
Polyunsaturated fat:
Poly. Fat
12.329 g
0
89%
7%
4%
Saturated fat:
Sat. Fat
20.099 g
Monounsaturated fat:
Mono. Fat
1.61 g
Polyunsaturated fat:
Poly. Fat
0.81 g
Contains
less
Sat. Fat Saturated fat
-81.1%
Contains
more
Mono. Fat Monounsaturated fat
+1859.7%
Contains
more
Poly. Fat Polyunsaturated fat
+1422.1%