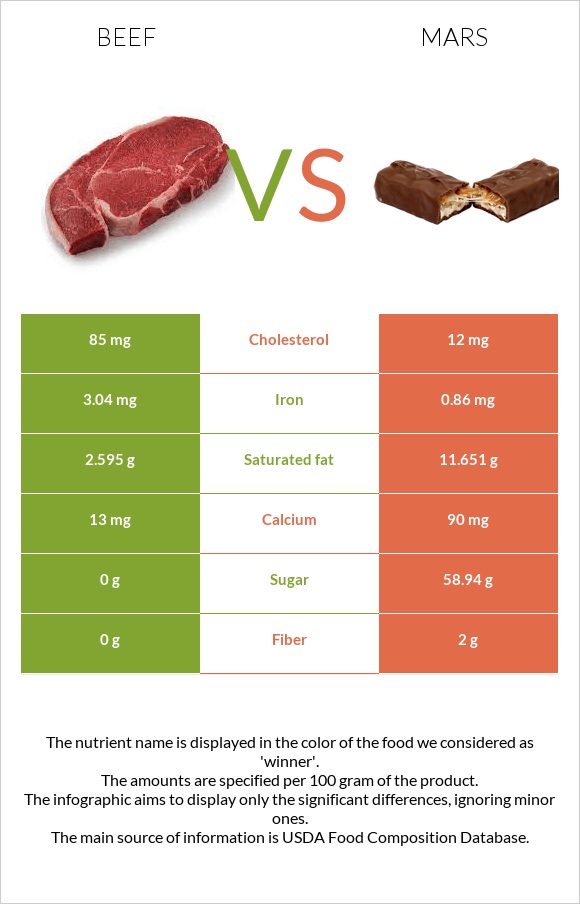
How are beef and mars different? Beef is higher in iron; however, mars is richer in fiber and calcium. Daily need coverage for saturated fat for mars is 45% higher. Beef contains 7 times more cholesterol than mars. While beef contains 85mg of cholesterol, mars contains only 12mg. Beef has a lower glycemic index (0) than mars (62). Beef, loin, tenderloin roast, separable lean only, boneless, trimmed to 0" fat, select, cooked, roasted and Candies, MARS SNACKFOOD US, M&M's Crispy Chocolate Candies are the varieties used in this article.
Infographic
Mineral Comparison
Mineral comparison score is based on the number of minerals by which one or the other food is richer. The "coverage" charts below show how much of the daily needs can be covered by 300 grams of the food.
9
100 g
300 g
3 oz - 85g 1 roast - 487g
Magnesium
Magnesium
Calcium
Calcium
Potassium
Potassium
Iron
Iron
Copper
Copper
Zinc
Zinc
Phosphorus
Phosphorus
Sodium
Sodium
Manganese
Manganese
Selenium
Selenium
10%
3.9%
31%
114%
32%
101%
111%
7%
1.2%
139%
1
100 g
300 g
1 serving 1.6 oz bag - 47g
Magnesium
Magnesium
Calcium
Calcium
Potassium
Potassium
Iron
Iron
Copper
Copper
Zinc
Zinc
Phosphorus
Phosphorus
Sodium
Sodium
Manganese
Manganese
Selenium
Selenium
0%
27%
0%
32%
0%
0%
0%
18%
0%
0%
Vitamin Comparison
Vitamin comparison score is based on the number of vitamins by which one or the other food is richer. The "coverage" charts below show how much of the daily needs can be covered by 300 grams of the food.
11
100 g
300 g
3 oz - 85g 1 roast - 487g
Vitamin C
Vit. C
Vitamin D
Vit. D
Vitamin A
Vit. A
Vitamin E
Vit. E
Vitamin B1
Vit. B1
Vitamin B2
Vit. B2
Vitamin B3
Vit. B3
Vitamin B5
Vit. B5
Vitamin B6
Vit. B6
Vitamin B12
Vit. B12
Vitamin K
Vit. K
Folate
Folate
0%
1.5%
0.67%
5%
19%
92%
108%
29%
154%
526%
4%
5.3%
1
100 g
300 g
1 serving 1.6 oz bag - 47g
Vitamin C
Vit. C
Vitamin D
Vit. D
Vitamin A
Vit. A
Vitamin E
Vit. E
Vitamin B1
Vit. B1
Vitamin B2
Vit. B2
Vitamin B3
Vit. B3
Vitamin B5
Vit. B5
Vitamin B6
Vit. B6
Vitamin B12
Vit. B12
Vitamin K
Vit. K
Folate
Folate
1.7%
0%
0%
0%
0%
0%
0%
0%
0%
0%
0%
0%
All nutrients comparison - raw data values
Nutrient
DV% diff.
Vitamin B12
4.21µg
175%
Vitamin B6
0.669mg
51%
Protein
27.55g
4.28g
47%
Selenium
25.4µg
46%
Saturated fat
2.595g
11.651g
41%
Phosphorus
259mg
37%
Vitamin B3
5.76mg
36%
Zinc
3.7mg
34%
Vitamin B2
0.4mg
31%
Iron
3.04mg
0.86mg
27%
Carbs
0g
72.4g
24%
Cholesterol
85mg
12mg
24%
Fats
6.54g
19.32g
20%
Calories
169kcal
475kcal
15%
Choline
75.6mg
14%
Copper
0.097mg
11%
Potassium
352mg
10%
Vitamin B5
0.481mg
10%
Calcium
13mg
90mg
8%
Fiber
0g
2g
8%
Monounsaturated fat
2.734g
7%
Vitamin B1
0.074mg
6%
Sodium
54mg
136mg
4%
Polyunsaturated fat
0.532g
4%
Magnesium
14mg
3%
Vitamin E
0.25mg
2%
Folate
7µg
2%
Vitamin C
0mg
0.5mg
1%
Vitamin D
0.1µg
1%
Vitamin K
1.6µg
1%
Protein per 100 calories
16g
0.9g
N/A
Calories per 10 g protein
61kcal
1110kcal
N/A
Weight per 100 calories
59g
21g
N/A
Unsaturated / Saturated Fat ratio
1.3
0
N/A
Net carbs
0g
70.4g
N/A
Vitamin D*
3 IU
0%
Sugar
0g
58.94g
N/A
Vitamin A
2µg
0%
Manganese
0.009mg
0%
Trans fat
0.375g
0.131g
N/A
Tryptophan
0.359mg
0%
Threonine
1.534mg
0%
Isoleucine
1.52mg
0%
Leucine
2.833mg
0%
Lysine
3.178mg
0%
Methionine
0.871mg
0%
Phenylalanine
1.299mg
0%
Valine
1.603mg
0%
Histidine
1.244mg
0%
Omega-3 - EPA
0.002g
N/A
Omega-3 - DHA
0.002g
N/A
Omega-3 - ALA
0.013g
N/A
Omega-3 - DPA
0.011g
N/A
Omega-6 - Dihomo-gamma-linoleic acid
0.017g
N/A
Omega-6 - Eicosadienoic acid
0.002g
N/A
Omega-6 - Linoleic acid
0.349g
N/A
Macronutrient Comparison
Macronutrient breakdown side-by-side comparison
2
28%
7%
66%
Protein:
27.55 g
Fats:
6.54 g
Carbs:
0 g
Water:
65.71 g
Other:
0.2 g
3
4%
19%
72%
2%
2%
Protein:
4.28 g
Fats:
19.32 g
Carbs:
72.4 g
Water:
1.7 g
Other:
2.3 g
Contains
more
Protein Protein
+543.7%
Contains
more
Water Water
+3765.3%
Contains
more
Fats Fats
+195.4%
Contains
more
Carbs Carbs
+∞%
Contains
more
Other Other
+1050%
Fat Type Comparison
Fat type breakdown side-by-side comparison
3
44%
47%
9%
Saturated fat:
Sat. Fat
2.595 g
Monounsaturated fat:
Mono. Fat
2.734 g
Polyunsaturated fat:
Poly. Fat
0.532 g
0
100%
Saturated fat:
Sat. Fat
11.651 g
Monounsaturated fat:
Mono. Fat
0 g
Polyunsaturated fat:
Poly. Fat
0 g
Contains
less
Sat. Fat Saturated fat
-77.7%
Contains
more
Mono. Fat Monounsaturated fat
+∞%
Contains
more
Poly. Fat Polyunsaturated fat
+∞%