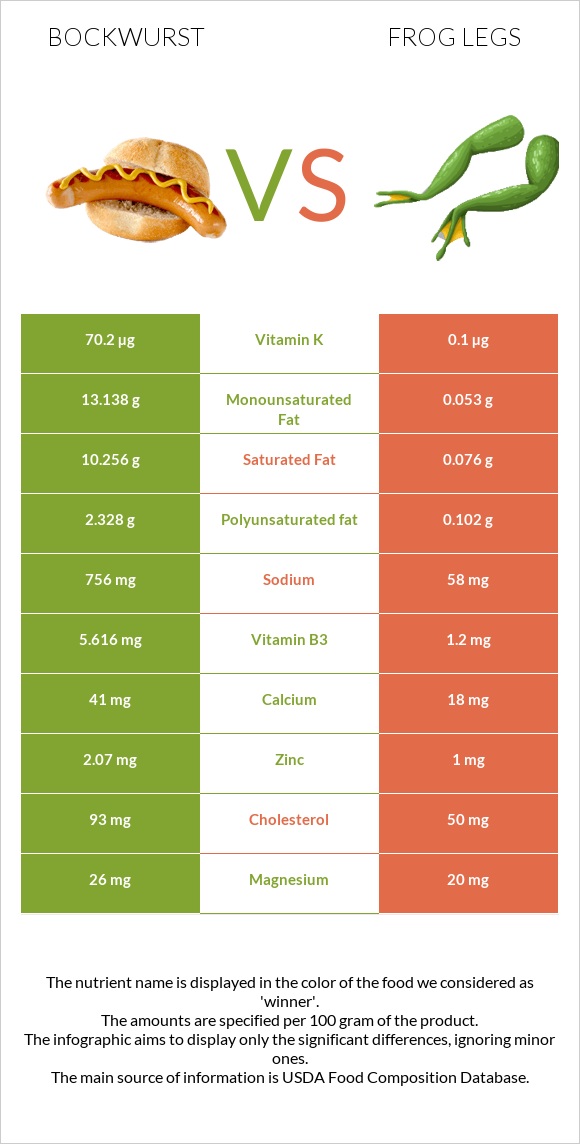
What are the main differences between bockwurst and frog legs? Bockwurst is richer in vitamin K, vitamin B3, vitamin B6, vitamin B12, and zinc, yet frog legs are richer in copper and selenium. Bockwurst's daily need coverage for vitamin K is 58% higher. Bockwurst has 135 times more saturated fat than frog legs. Bockwurst has 10.256g of saturated fat, while frog legs have 0.076g. Frog legs have a lower glycemic index than bockwurst. We used Bockwurst, pork, veal, raw and Frog legs, raw types in this comparison.
Infographic
Mineral Comparison
Mineral comparison score is based on the number of minerals by which one or the other food is richer. The "coverage" charts below show how much of the daily needs can be covered by 300 grams of the food.
5
100 g
300 g
1 sausage - 91g
Magnesium
Magnesium
Calcium
Calcium
Potassium
Potassium
Iron
Iron
Copper
Copper
Zinc
Zinc
Phosphorus
Phosphorus
Sodium
Sodium
Manganese
Manganese
Selenium
Selenium
19%
12%
24%
43%
33%
56%
72%
99%
22%
62%
4
100 g
300 g
1 leg - 45g
Magnesium
Magnesium
Calcium
Calcium
Potassium
Potassium
Iron
Iron
Copper
Copper
Zinc
Zinc
Phosphorus
Phosphorus
Sodium
Sodium
Manganese
Manganese
Selenium
Selenium
14%
5.4%
25%
56%
83%
27%
63%
7.6%
0%
77%
Vitamin Comparison
Vitamin comparison score is based on the number of vitamins by which one or the other food is richer. The "coverage" charts below show how much of the daily needs can be covered by 300 grams of the food.
8
100 g
300 g
1 sausage - 91g
Vitamin C
Vit. C
Vitamin D
Vit. D
Vitamin A
Vit. A
Vitamin E
Vit. E
Vitamin B1
Vit. B1
Vitamin B2
Vit. B2
Vitamin B3
Vit. B3
Vitamin B5
Vit. B5
Vitamin B6
Vit. B6
Vitamin B12
Vit. B12
Vitamin K
Vit. K
Folate
Folate
11%
0%
5%
7.6%
48%
54%
105%
53%
87%
108%
176%
13%
2
100 g
300 g
1 leg - 45g
Vitamin C
Vit. C
Vitamin D
Vit. D
Vitamin A
Vit. A
Vitamin E
Vit. E
Vitamin B1
Vit. B1
Vitamin B2
Vit. B2
Vitamin B3
Vit. B3
Vitamin B5
Vit. B5
Vitamin B6
Vit. B6
Vitamin B12
Vit. B12
Vitamin K
Vit. K
Folate
Folate
0%
3%
5%
20%
35%
58%
23%
0%
28%
50%
0.25%
11%
All nutrients comparison - raw data values
Nutrient
DV% diff.
Vitamin K
70.2µg
0.1µg
58%
Tryptophan
153mg
55%
Saturated fat
10.256g
0.076g
46%
Fats
25.87g
0.3g
39%
Monounsaturated fat
13.138g
0.053g
33%
Sodium
756mg
58mg
30%
Vitamin B3
5.616mg
1.2mg
28%
Vitamin B6
0.378mg
0.12mg
20%
Vitamin B12
0.86µg
0.4µg
19%
Vitamin B5
0.891mg
18%
Copper
0.1mg
0.25mg
17%
Polyunsaturated fat
2.328g
0.102g
15%
Cholesterol
93mg
50mg
14%
Calories
301kcal
73kcal
11%
Zinc
2.07mg
1mg
10%
Manganese
0.171mg
7%
Protein
14.03g
16.4g
5%
Selenium
11.3µg
14.1µg
5%
Vitamin C
3.2mg
0mg
4%
Iron
1.15mg
1.5mg
4%
Fiber
1g
0g
4%
Vitamin E
0.38mg
1mg
4%
Vitamin B1
0.193mg
0.14mg
4%
Phosphorus
169mg
147mg
3%
Choline
46.4mg
65mg
3%
Calcium
41mg
18mg
2%
Carbs
2.95g
0g
1%
Vitamin D*
0 IU
8 IU
1%
Vitamin D
0µg
0.2µg
1%
Magnesium
26mg
20mg
1%
Vitamin B2
0.233mg
0.25mg
1%
Folate
17µg
15µg
1%
Protein per 100 calories
4.7g
22g
N/A
Calories per 10 g protein
215kcal
45kcal
N/A
Weight per 100 calories
33g
137g
N/A
Unsaturated / Saturated Fat ratio
1.5
2
N/A
Net carbs
1.95g
0g
N/A
Potassium
270mg
285mg
0%
Sugar
1.33g
0g
N/A
Vitamin A
15µg
15µg
0%
Threonine
0.613mg
0%
Isoleucine
0.677mg
0%
Leucine
1.107mg
0%
Lysine
1.166mg
0%
Methionine
0.333mg
0%
Phenylalanine
0.556mg
0%
Valine
0.767mg
0%
Histidine
0.513mg
0%
Fructose
0.01g
0%
Omega-3 - EPA
0g
0.014g
N/A
Omega-3 - DHA
0g
0.02g
N/A
Omega-3 - DPA
0g
0.007g
N/A
Macronutrient Comparison
Macronutrient breakdown side-by-side comparison
3
14%
26%
3%
54%
3%
Protein:
14.03 g
Fats:
25.87 g
Carbs:
2.95 g
Water:
54.47 g
Other:
2.68 g
2
16%
82%
Protein:
16.4 g
Fats:
0.3 g
Carbs:
0 g
Water:
81.9 g
Other:
1.4 g
Contains
more
Fats Fats
+8523.3%
Contains
more
Carbs Carbs
+∞%
Contains
more
Other Other
+91.4%
Contains
more
Protein Protein
+16.9%
Contains
more
Water Water
+50.4%
Fat Type Comparison
Fat type breakdown side-by-side comparison
2
40%
51%
9%
Saturated fat:
Sat. Fat
10.256 g
Monounsaturated fat:
Mono. Fat
13.138 g
Polyunsaturated fat:
Poly. Fat
2.328 g
1
33%
23%
44%
Saturated fat:
Sat. Fat
0.076 g
Monounsaturated fat:
Mono. Fat
0.053 g
Polyunsaturated fat:
Poly. Fat
0.102 g
Contains
more
Mono. Fat Monounsaturated fat
+24688.7%
Contains
more
Poly. Fat Polyunsaturated fat
+2182.4%
Contains
less
Sat. Fat Saturated fat
-99.3%