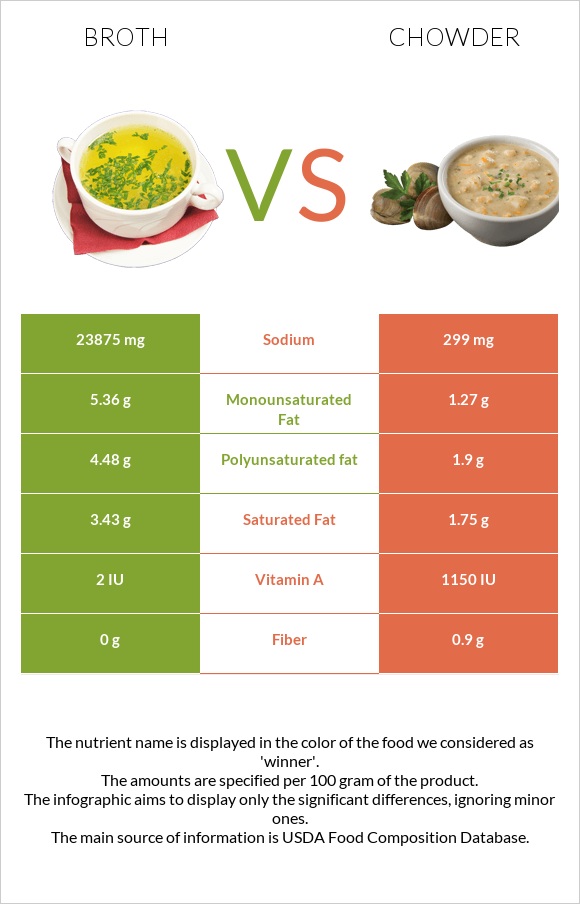
A recap on the differences between broth and chowder Broth has more polyunsaturated fat and monounsaturated fat; however, chowder is higher in vitamin A. Broth covers your daily sodium needs 1025% more than chowder. Chowder contains 4 times less monounsaturated fat than broth. Broth contains 5.36g of monounsaturated fat, while chowder contains 1.27g. Chowder has less sodium. The glycemic index of broth is higher. Food varieties used in this article are Soup, chicken broth or bouillon, dry and Soup, chicken corn chowder, chunky, ready-to-serve, single brand .
Infographic
Mineral Comparison
Mineral comparison score is based on the number of minerals by which one or the other food is richer. The "coverage" charts below show how much of the daily needs can be covered by 300 grams of the food.
8
100 g
300 g
1 teaspoon - 2g 1 cube - 4g
Magnesium
Magnesium
Calcium
Calcium
Potassium
Potassium
Iron
Iron
Copper
Copper
Zinc
Zinc
Phosphorus
Phosphorus
Sodium
Sodium
Manganese
Manganese
Selenium
Selenium
40%
56%
27%
39%
0%
2.5%
71%
3114%
20%
153%
1
100 g
300 g
1 serving - 240g 1 package yields - 539g
Magnesium
Magnesium
Calcium
Calcium
Potassium
Potassium
Iron
Iron
Copper
Copper
Zinc
Zinc
Phosphorus
Phosphorus
Sodium
Sodium
Manganese
Manganese
Selenium
Selenium
0%
0%
0%
0%
0%
0%
0%
39%
0%
0%
Vitamin Comparison
Vitamin comparison score is based on the number of vitamins by which one or the other food is richer. The "coverage" charts below show how much of the daily needs can be covered by 300 grams of the food.
9
100 g
300 g
1 teaspoon - 2g 1 cube - 4g
Vitamin C
Vit. C
Vitamin D
Vit. D
Vitamin A
Vit. A
Vitamin E
Vit. E
Vitamin B1
Vit. B1
Vitamin B2
Vit. B2
Vitamin B3
Vit. B3
Vitamin B5
Vit. B5
Vitamin B6
Vit. B6
Vitamin B12
Vit. B12
Vitamin K
Vit. K
Folate
Folate
3.7%
0%
0%
9.2%
25%
99%
46%
36%
23%
38%
0%
24%
1
100 g
300 g
1 serving - 240g 1 package yields - 539g
Vitamin C
Vit. C
Vitamin D
Vit. D
Vitamin A
Vit. A
Vitamin E
Vit. E
Vitamin B1
Vit. B1
Vitamin B2
Vit. B2
Vitamin B3
Vit. B3
Vitamin B5
Vit. B5
Vitamin B6
Vit. B6
Vitamin B12
Vit. B12
Vitamin K
Vit. K
Folate
Folate
0%
0%
19%
0%
0%
0%
0%
0%
0%
0%
0%
0%
All nutrients comparison - raw data values
Nutrient
DV% diff.
Sodium
23875mg
299mg
1025%
Selenium
28µg
51%
Vitamin B2
0.43mg
33%
Protein
16.66g
3.1g
27%
Phosphorus
166mg
24%
Choline
114.6mg
21%
Calcium
187mg
19%
Polyunsaturated fat
4.48g
1.9g
17%
Vitamin B3
2.46mg
15%
Magnesium
56mg
13%
Iron
1.03mg
13%
Vitamin B12
0.3µg
13%
Fats
13.88g
6.3g
12%
Vitamin B5
0.6mg
12%
Monounsaturated fat
5.36g
1.27g
10%
Potassium
309mg
9%
Calories
267kcal
99kcal
8%
Vitamin B1
0.1mg
8%
Vitamin B6
0.1mg
8%
Folate
32µg
8%
Saturated fat
3.43g
1.75g
8%
Manganese
0.15mg
7%
Vitamin A
0µg
58µg
6%
Carbs
18.01g
7.5g
4%
Fiber
0g
0.9g
4%
Vitamin E
0.46mg
3%
Vitamin C
1.1mg
1%
Cholesterol
13mg
11mg
1%
Zinc
0.09mg
1%
Protein per 100 calories
6.2g
3.1g
N/A
Calories per 10 g protein
160kcal
319kcal
N/A
Weight per 100 calories
37g
101g
N/A
Unsaturated / Saturated Fat ratio
2.9
1.8
N/A
Net carbs
18.01g
6.6g
N/A
Sugar
17.36g
N/A
Macronutrient Comparison
Macronutrient breakdown side-by-side comparison
4
17%
14%
18%
2%
49%
Protein:
16.66 g
Fats:
13.88 g
Carbs:
18.01 g
Water:
2.27 g
Other:
49.18 g
1
3%
6%
8%
82%
Protein:
3.1 g
Fats:
6.3 g
Carbs:
7.5 g
Water:
82.1 g
Other:
1 g
Contains
more
Protein Protein
+437.4%
Contains
more
Fats Fats
+120.3%
Contains
more
Carbs Carbs
+140.1%
Contains
more
Other Other
+4818%
Contains
more
Water Water
+3516.7%
Fat Type Comparison
Fat type breakdown side-by-side comparison
2
26%
40%
34%
Saturated fat:
Sat. Fat
3.43 g
Monounsaturated fat:
Mono. Fat
5.36 g
Polyunsaturated fat:
Poly. Fat
4.48 g
1
36%
26%
39%
Saturated fat:
Sat. Fat
1.75 g
Monounsaturated fat:
Mono. Fat
1.27 g
Polyunsaturated fat:
Poly. Fat
1.9 g
Contains
more
Mono. Fat Monounsaturated fat
+322%
Contains
more
Poly. Fat Polyunsaturated fat
+135.8%
Contains
less
Sat. Fat Saturated fat
-49%