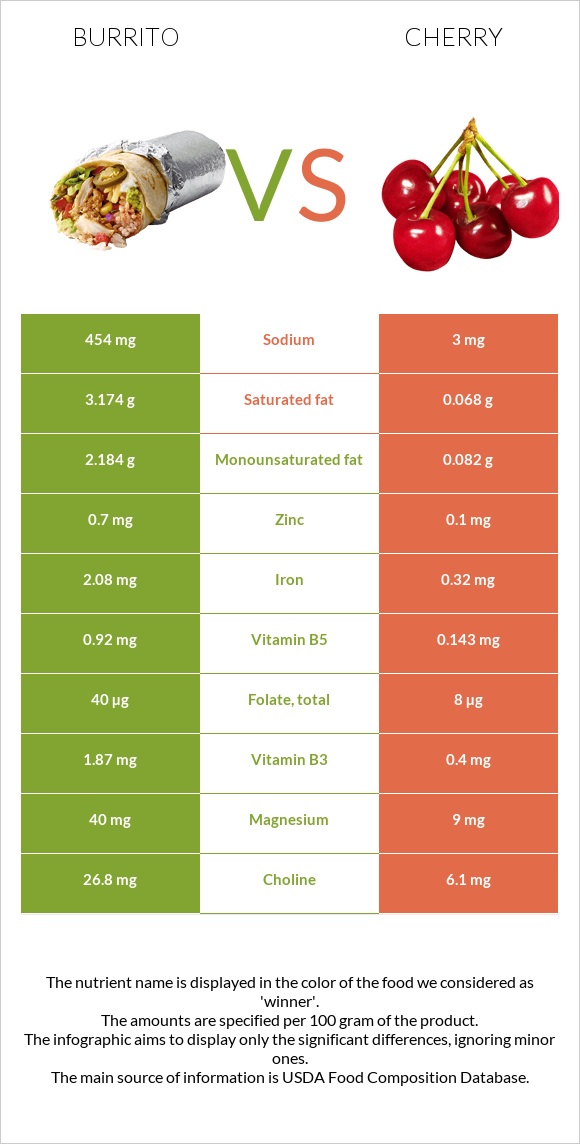
Summary of differences between burrito and cherries Burrito has more iron, vitamin B1, vitamin B12, vitamin B2, selenium, vitamin B5, and manganese, while cherries have more vitamin A. Cherries cover your daily need for vitamin A, 23% more than burrito. The amount of sodium in cherries is lower. Cherries have a lower glycemic index. The glycemic index of cherries is 22, while the glycemic index of burrito is 37. These are the specific foods used in this comparison Fast foods, burrito, with beans and Cherries, sour, red, raw .
Infographic
Mineral Comparison
Mineral comparison score is based on the number of minerals by which one or the other food is richer. The "coverage" charts below show how much of the daily needs can be covered by 300 grams of the food.
9
100 g
300 g
2 pieces - 217g
Magnesium
Magnesium
Calcium
Calcium
Potassium
Potassium
Iron
Iron
Copper
Copper
Zinc
Zinc
Phosphorus
Phosphorus
Sodium
Sodium
Manganese
Manganese
Selenium
Selenium
29%
16%
27%
78%
58%
19%
19%
59%
52%
55%
1
100 g
300 g
1 cup, with pits, yields - 103g 1 cup, without pits - 155g
Magnesium
Magnesium
Calcium
Calcium
Potassium
Potassium
Iron
Iron
Copper
Copper
Zinc
Zinc
Phosphorus
Phosphorus
Sodium
Sodium
Manganese
Manganese
Selenium
Selenium
6.4%
4.8%
15%
12%
35%
2.7%
6.4%
0.39%
15%
0%
Vitamin Comparison
Vitamin comparison score is based on the number of vitamins by which one or the other food is richer. The "coverage" charts below show how much of the daily needs can be covered by 300 grams of the food.
7
100 g
300 g
2 pieces - 217g
Vitamin C
Vit. C
Vitamin D
Vit. D
Vitamin A
Vit. A
Vitamin E
Vit. E
Vitamin B1
Vit. B1
Vitamin B2
Vit. B2
Vitamin B3
Vit. B3
Vitamin B5
Vit. B5
Vitamin B6
Vit. B6
Vitamin B12
Vit. B12
Vitamin K
Vit. K
Folate
Folate
3%
0%
0%
0%
73%
65%
35%
55%
32%
63%
0%
30%
4
100 g
300 g
1 cup, with pits, yields - 103g 1 cup, without pits - 155g
Vitamin C
Vit. C
Vitamin D
Vit. D
Vitamin A
Vit. A
Vitamin E
Vit. E
Vitamin B1
Vit. B1
Vitamin B2
Vit. B2
Vitamin B3
Vit. B3
Vitamin B5
Vit. B5
Vitamin B6
Vit. B6
Vitamin B12
Vit. B12
Vitamin K
Vit. K
Folate
Folate
33%
0%
21%
1.4%
7.5%
9.2%
7.5%
8.6%
10%
0%
5.3%
6%
All nutrients comparison - raw data values
Nutrient
DV% diff.
Iron
2.08mg
0.32mg
22%
Vitamin B1
0.29mg
0.03mg
22%
Vitamin B12
0.5µg
0µg
21%
Sodium
454mg
3mg
20%
Selenium
10.1µg
0µg
18%
Vitamin B2
0.28mg
0.04mg
18%
Vitamin B5
0.92mg
0.143mg
16%
Saturated fat
3.174g
0.068g
14%
Manganese
0.4mg
0.112mg
13%
Protein
6.48g
1g
11%
Vitamin C
0.9mg
10mg
10%
Fats
6.22g
0.3g
9%
Vitamin B3
1.87mg
0.4mg
9%
Calories
206kcal
50kcal
8%
Copper
0.174mg
0.104mg
8%
Folate
40µg
8µg
8%
Carbs
32.92g
12.18g
7%
Magnesium
40mg
9mg
7%
Vitamin A
64µg
7%
Vitamin B6
0.14mg
0.044mg
7%
Fiber
1.6g
6%
Zinc
0.7mg
0.1mg
5%
Monounsaturated fat
2.184g
0.082g
5%
Calcium
52mg
16mg
4%
Potassium
301mg
173mg
4%
Phosphorus
45mg
15mg
4%
Choline
26.8mg
6.1mg
4%
Fructose
3.51g
4%
Polyunsaturated fat
0.551g
0.09g
3%
Vitamin K
2.1µg
2%
Cholesterol
2mg
0mg
1%
Protein per 100 calories
3.1g
2g
N/A
Calories per 10 g protein
318kcal
500kcal
N/A
Weight per 100 calories
49g
200g
N/A
Unsaturated / Saturated Fat ratio
0.86
2.5
N/A
Net carbs
32.92g
10.58g
N/A
Sugar
8.49g
N/A
Vitamin E
0.07mg
0%
Tryptophan
0.079mg
0%
Threonine
0.244mg
0%
Isoleucine
0.27mg
0%
Leucine
0.504mg
0%
Lysine
0.343mg
0%
Methionine
0.107mg
0%
Phenylalanine
0.351mg
0%
Valine
0.319mg
0%
Histidine
0.172mg
0%
Macronutrient Comparison
Macronutrient breakdown side-by-side comparison
4
6%
6%
33%
53%
2%
Protein:
6.48 g
Fats:
6.22 g
Carbs:
32.92 g
Water:
52.53 g
Other:
1.85 g
1
12%
86%
Protein:
1 g
Fats:
0.3 g
Carbs:
12.18 g
Water:
86.13 g
Other:
0.39 g
Contains
more
Protein Protein
+548%
Contains
more
Fats Fats
+1973.3%
Contains
more
Carbs Carbs
+170.3%
Contains
more
Other Other
+374.4%
Contains
more
Water Water
+64%
Fat Type Comparison
Fat type breakdown side-by-side comparison
2
54%
37%
9%
Saturated fat:
Sat. Fat
3.174 g
Monounsaturated fat:
Mono. Fat
2.184 g
Polyunsaturated fat:
Poly. Fat
0.551 g
1
28%
34%
38%
Saturated fat:
Sat. Fat
0.068 g
Monounsaturated fat:
Mono. Fat
0.082 g
Polyunsaturated fat:
Poly. Fat
0.09 g
Contains
more
Mono. Fat Monounsaturated fat
+2563.4%
Contains
more
Poly. Fat Polyunsaturated fat
+512.2%
Contains
less
Sat. Fat Saturated fat
-97.9%