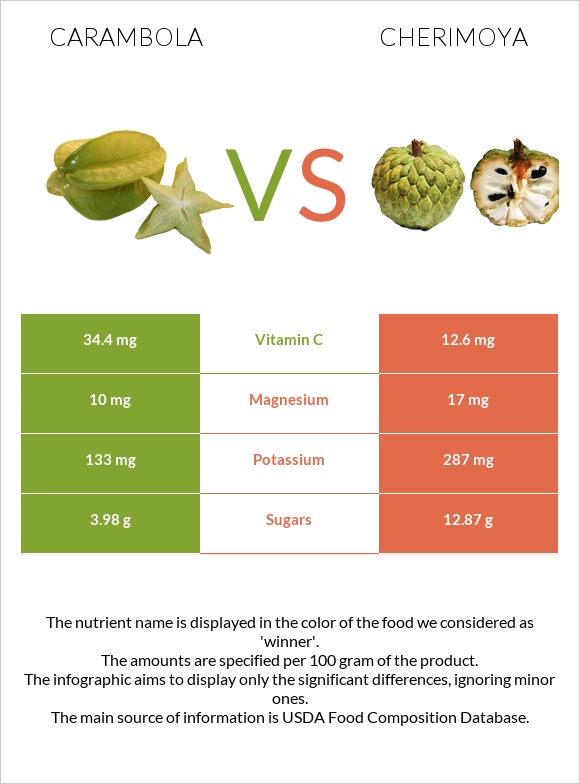
Important differences between carambola and cherimoya Carambola has more vitamin C and copper; however, cherimoya is richer in vitamin B6, vitamin B2, and vitamin B1. Carambola's daily need coverage for vitamin C is 24% more. Carambola contains 2 times more copper than cherimoya. Carambola contains 0.137mg of copper, while cherimoya contains 0.069mg. Carambola contains less sugar. Cherimoya has a higher glycemic index. The glycemic index of cherimoya is 59, while the glycemic index of carambola is 45. The food varieties used in the comparison are Carambola, (starfruit), raw and Cherimoya, raw .
Infographic
Mineral Comparison
Mineral comparison score is based on the number of minerals by which one or the other food is richer. The "coverage" charts below show how much of the daily needs can be covered by 300 grams of the food.
3
100 g
300 g
1 small (3-1/8" long) - 70g 1 medium (3-5/8" long) - 91g 1 cup, sliced - 108g 1 large (4-1/2" long) - 124g 1 cup, cubes - 132g
Magnesium
Magnesium
Calcium
Calcium
Potassium
Potassium
Iron
Iron
Copper
Copper
Zinc
Zinc
Phosphorus
Phosphorus
Sodium
Sodium
Manganese
Manganese
Selenium
Selenium
7.1%
0.9%
12%
3%
46%
3.3%
5.1%
0.26%
4.8%
3.3%
7
100 g
300 g
1 cup, pieces - 160g 1 fruit without skin and seeds - 235g
Magnesium
Magnesium
Calcium
Calcium
Potassium
Potassium
Iron
Iron
Copper
Copper
Zinc
Zinc
Phosphorus
Phosphorus
Sodium
Sodium
Manganese
Manganese
Selenium
Selenium
12%
3%
25%
10%
23%
4.4%
11%
0.91%
12%
0%
Vitamin Comparison
Vitamin comparison score is based on the number of vitamins by which one or the other food is richer. The "coverage" charts below show how much of the daily needs can be covered by 300 grams of the food.
3
100 g
300 g
1 small (3-1/8" long) - 70g 1 medium (3-5/8" long) - 91g 1 cup, sliced - 108g 1 large (4-1/2" long) - 124g 1 cup, cubes - 132g
Vitamin C
Vit. C
Vitamin D
Vit. D
Vitamin A
Vit. A
Vitamin E
Vit. E
Vitamin B1
Vit. B1
Vitamin B2
Vit. B2
Vitamin B3
Vit. B3
Vitamin B5
Vit. B5
Vitamin B6
Vit. B6
Vitamin B12
Vit. B12
Vitamin K
Vit. K
Folate
Folate
115%
0%
1%
3%
3.5%
3.7%
6.9%
23%
3.9%
0%
0%
9%
6
100 g
300 g
1 cup, pieces - 160g 1 fruit without skin and seeds - 235g
Vitamin C
Vit. C
Vitamin D
Vit. D
Vitamin A
Vit. A
Vitamin E
Vit. E
Vitamin B1
Vit. B1
Vitamin B2
Vit. B2
Vitamin B3
Vit. B3
Vitamin B5
Vit. B5
Vitamin B6
Vit. B6
Vitamin B12
Vit. B12
Vitamin K
Vit. K
Folate
Folate
42%
0%
0%
5.4%
25%
30%
12%
21%
59%
0%
0%
17%
All nutrients comparison - raw data values
Nutrient
DV% diff.
Vitamin C
34.4mg
12.6mg
24%
Vitamin B6
0.017mg
0.257mg
18%
Vitamin B2
0.016mg
0.131mg
9%
Copper
0.137mg
0.069mg
8%
Fructose
6.28g
8%
Vitamin B1
0.014mg
0.101mg
7%
Potassium
133mg
287mg
5%
Carbs
6.73g
17.71g
4%
Folate
12µg
23µg
3%
Calories
31kcal
75kcal
2%
Magnesium
10mg
17mg
2%
Iron
0.08mg
0.27mg
2%
Phosphorus
12mg
26mg
2%
Manganese
0.037mg
0.093mg
2%
Vitamin B3
0.367mg
0.644mg
2%
Protein
1.04g
1.57g
1%
Fats
0.33g
0.68g
1%
Calcium
3mg
10mg
1%
Fiber
2.8g
3g
1%
Vitamin E
0.15mg
0.27mg
1%
Selenium
0.6µg
1%
Vitamin B5
0.391mg
0.345mg
1%
Choline
7.6mg
1%
Saturated fat
0.019g
0.233g
1%
Protein per 100 calories
3.4g
2.1g
N/A
Calories per 10 g protein
298kcal
478kcal
N/A
Weight per 100 calories
323g
133g
N/A
Net carbs
3.93g
14.71g
N/A
Sugar
3.98g
12.87g
N/A
Zinc
0.12mg
0.16mg
0%
Sodium
2mg
7mg
0%
Vitamin A
3µg
0µg
0%
Monounsaturated fat
0.03g
0.055g
0%
Polyunsaturated fat
0.184g
0.188g
0%
Tryptophan
0.008mg
0.031mg
0%
Threonine
0.044mg
0.052mg
0%
Isoleucine
0.044mg
0.042mg
0%
Leucine
0.077mg
0.063mg
0%
Lysine
0.077mg
0.042mg
0%
Methionine
0.021mg
0.021mg
0%
Phenylalanine
0.037mg
0.042mg
0%
Valine
0.05mg
0.063mg
0%
Histidine
0.008mg
0.021mg
0%
Omega-3 - ALA
0.159g
N/A
Omega-6 - Linoleic acid
0.028g
N/A
Macronutrient Comparison
Macronutrient breakdown side-by-side comparison
1
7%
91%
Protein:
1.04 g
Fats:
0.33 g
Carbs:
6.73 g
Water:
91.38 g
Other:
0.52 g
4
18%
79%
Protein:
1.57 g
Fats:
0.68 g
Carbs:
17.71 g
Water:
79.39 g
Other:
0.65 g
Contains
more
Water Water
+15.1%
Contains
more
Protein Protein
+51%
Contains
more
Fats Fats
+106.1%
Contains
more
Carbs Carbs
+163.2%
Contains
more
Other Other
+25%
Fat Type Comparison
Fat type breakdown side-by-side comparison
1
8%
13%
79%
Saturated fat:
Sat. Fat
0.019 g
Monounsaturated fat:
Mono. Fat
0.03 g
Polyunsaturated fat:
Poly. Fat
0.184 g
2
49%
12%
39%
Saturated fat:
Sat. Fat
0.233 g
Monounsaturated fat:
Mono. Fat
0.055 g
Polyunsaturated fat:
Poly. Fat
0.188 g
Contains
less
Sat. Fat Saturated fat
-91.8%
Contains
more
Mono. Fat Monounsaturated fat
+83.3%
~equal in
Polyunsaturated fat
~0.188g