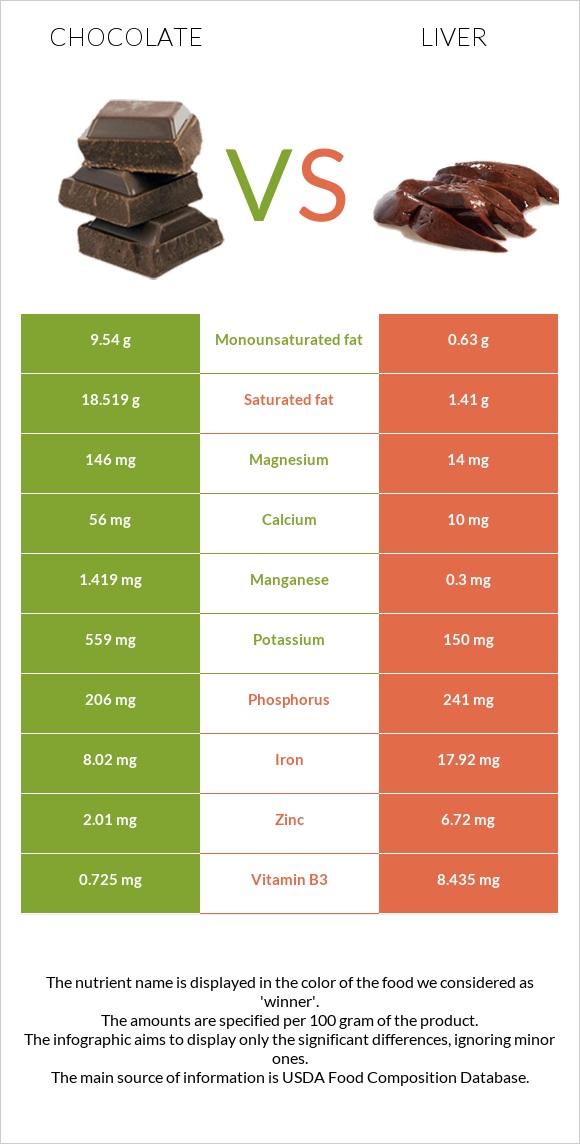
Summary of differences between chocolate and liver Chocolate has more manganese, while liver has more vitamin B12, vitamin A, vitamin B2, iron, selenium, vitamin B5, and vitamin B3. Liver covers your daily need for vitamin B12, 768% more than chocolate. Chocolate contains 13 times more saturated fat than liver. While chocolate contains 18.519g of saturated fat, liver contains only 1.41g. Liver has a lower glycemic index. The glycemic index of liver is 0, while the glycemic index of chocolate is 23. These are the specific foods used in this comparison Chocolate, dark, 45- 59% cacao solids and Pork, fresh, variety meats, and by-products, liver, cooked, braised .
Infographic
Mineral Comparison
Mineral comparison score is based on the number of minerals by which one or the other food is richer. The "coverage" charts below show how much of the daily needs can be covered by 300 grams of the food.
6
100 g
300 g
1 oz - 28.35g 1 bar - 162g
Magnesium
Magnesium
Calcium
Calcium
Potassium
Potassium
Iron
Iron
Copper
Copper
Zinc
Zinc
Phosphorus
Phosphorus
Sodium
Sodium
Manganese
Manganese
Selenium
Selenium
104%
17%
49%
301%
343%
55%
88%
3.1%
185%
16%
4
100 g
300 g
3 oz - 85g
Magnesium
Magnesium
Calcium
Calcium
Potassium
Potassium
Iron
Iron
Copper
Copper
Zinc
Zinc
Phosphorus
Phosphorus
Sodium
Sodium
Manganese
Manganese
Selenium
Selenium
10%
3%
13%
672%
211%
183%
103%
6.4%
39%
368%
Vitamin Comparison
Vitamin comparison score is based on the number of vitamins by which one or the other food is richer. The "coverage" charts below show how much of the daily needs can be covered by 300 grams of the food.
2
100 g
300 g
1 oz - 28.35g 1 bar - 162g
Vitamin C
Vit. C
Vitamin D
Vit. D
Vitamin A
Vit. A
Vitamin E
Vit. E
Vitamin B1
Vit. B1
Vitamin B2
Vit. B2
Vitamin B3
Vit. B3
Vitamin B5
Vit. B5
Vitamin B6
Vit. B6
Vitamin B12
Vit. B12
Vitamin K
Vit. K
Folate
Folate
0%
0%
0.67%
11%
6.3%
12%
14%
18%
9.7%
29%
20%
0%
9
100 g
300 g
3 oz - 85g
Vitamin C
Vit. C
Vitamin D
Vit. D
Vitamin A
Vit. A
Vitamin E
Vit. E
Vitamin B1
Vit. B1
Vitamin B2
Vit. B2
Vitamin B3
Vit. B3
Vitamin B5
Vit. B5
Vitamin B6
Vit. B6
Vitamin B12
Vit. B12
Vitamin K
Vit. K
Folate
Folate
79%
0%
1802%
0%
65%
507%
158%
286%
132%
2334%
0%
122%
All nutrients comparison - raw data values
Nutrient
DV% diff.
Vitamin B12
0.23µg
18.67µg
768%
Vitamin A
2µg
5405µg
600%
Vitamin B2
0.05mg
2.196mg
165%
Iron
8.02mg
17.92mg
124%
Selenium
3µg
67.5µg
117%
Cholesterol
8mg
355mg
116%
Vitamin B5
0.297mg
4.774mg
90%
Saturated fat
18.519g
1.41g
78%
Manganese
1.419mg
0.3mg
49%
Vitamin B3
0.725mg
8.435mg
48%
Copper
1.028mg
0.634mg
44%
Zinc
2.01mg
6.72mg
43%
Protein
4.88g
26.02g
42%
Fats
31.28g
4.4g
41%
Vitamin B6
0.042mg
0.57mg
41%
Folate
163µg
41%
Magnesium
146mg
14mg
31%
Fiber
7g
0g
28%
Vitamin C
23.6mg
26%
Monounsaturated fat
9.54g
0.63g
22%
Calories
546kcal
165kcal
19%
Carbs
61.17g
3.76g
19%
Vitamin B1
0.025mg
0.258mg
19%
Potassium
559mg
150mg
12%
Caffeine
43mg
11%
Vitamin K
8.1µg
7%
Calcium
56mg
10mg
5%
Phosphorus
206mg
241mg
5%
Vitamin E
0.54mg
4%
Sodium
24mg
49mg
1%
Protein per 100 calories
0.89g
16g
N/A
Calories per 10 g protein
1119kcal
63kcal
N/A
Weight per 100 calories
18g
61g
N/A
Unsaturated / Saturated Fat ratio
0.57
1.2
N/A
Net carbs
54.17g
3.76g
N/A
Sugar
47.9g
N/A
Trans fat
0.112g
N/A
Polyunsaturated fat
1.092g
1.05g
0%
Tryptophan
0.366mg
0%
Threonine
1.107mg
0%
Isoleucine
1.32mg
0%
Leucine
2.319mg
0%
Lysine
2.007mg
0%
Methionine
0.645mg
0%
Phenylalanine
1.274mg
0%
Valine
1.607mg
0%
Histidine
0.708mg
0%
Omega-3 - EPA
0.001g
0g
N/A
Omega-3 - DHA
0g
0.03g
N/A
Omega-3 - ALA
0.085g
N/A
Omega-3 - DPA
0g
0.04g
N/A
Omega-6 - Eicosadienoic acid
0.001g
N/A
Omega-6 - Linoleic acid
0.947g
N/A
Macronutrient Comparison
Macronutrient breakdown side-by-side comparison
3
5%
31%
61%
2%
Protein:
4.88 g
Fats:
31.28 g
Carbs:
61.17 g
Water:
0.97 g
Other:
1.7 g
2
26%
4%
4%
64%
Protein:
26.02 g
Fats:
4.4 g
Carbs:
3.76 g
Water:
64.32 g
Other:
1.5 g
Contains
more
Fats Fats
+610.9%
Contains
more
Carbs Carbs
+1526.9%
Contains
more
Other Other
+13.3%
Contains
more
Protein Protein
+433.2%
Contains
more
Water Water
+6530.9%
Fat Type Comparison
Fat type breakdown side-by-side comparison
2
64%
33%
4%
Saturated fat:
Sat. Fat
18.519 g
Monounsaturated fat:
Mono. Fat
9.54 g
Polyunsaturated fat:
Poly. Fat
1.092 g
1
46%
20%
34%
Saturated fat:
Sat. Fat
1.41 g
Monounsaturated fat:
Mono. Fat
0.63 g
Polyunsaturated fat:
Poly. Fat
1.05 g
Contains
more
Mono. Fat Monounsaturated fat
+1414.3%
Contains
less
Sat. Fat Saturated fat
-92.4%
~equal in
Polyunsaturated fat
~1.05g