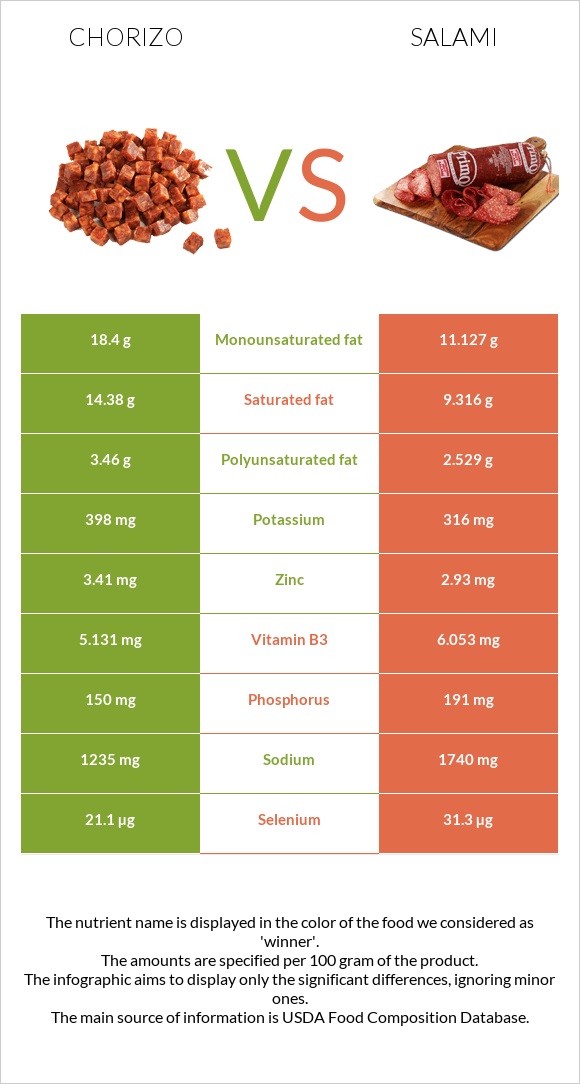
How are chorizo and salami different? Chorizo has more vitamin B1, vitamin B12, and vitamin B6; however, salami is richer in manganese, copper, selenium, phosphorus, and vitamin B3. Salami covers your daily need for manganese, 41% more than chorizo. Chorizo has 2 times more vitamin B1 than salami. Chorizo has 0.63mg of vitamin B1, while salami has 0.367mg. Salami contains less saturated fat. Chorizo, pork, and beef and Salami, cooked, beef, and pork types were used in this article.
Infographic
Mineral Comparison
Mineral comparison score is based on the number of minerals by which one or the other food is richer. The "coverage" charts below show how much of the daily needs can be covered by 300 grams of the food.
3
100 g
300 g
1 oz - 28.35g 1 link (4" long) - 60g
Magnesium
Magnesium
Calcium
Calcium
Potassium
Potassium
Iron
Iron
Copper
Copper
Zinc
Zinc
Phosphorus
Phosphorus
Sodium
Sodium
Manganese
Manganese
Selenium
Selenium
13%
2.4%
35%
60%
27%
93%
64%
161%
5.2%
115%
5
100 g
300 g
1 slice round - 12.3g
Magnesium
Magnesium
Calcium
Calcium
Potassium
Potassium
Iron
Iron
Copper
Copper
Zinc
Zinc
Phosphorus
Phosphorus
Sodium
Sodium
Manganese
Manganese
Selenium
Selenium
14%
4.5%
28%
59%
119%
80%
82%
227%
128%
171%
Vitamin Comparison
Vitamin comparison score is based on the number of vitamins by which one or the other food is richer. The "coverage" charts below show how much of the daily needs can be covered by 300 grams of the food.
4
100 g
300 g
1 oz - 28.35g 1 link (4" long) - 60g
Vitamin C
Vit. C
Vitamin D
Vit. D
Vitamin A
Vit. A
Vitamin E
Vit. E
Vitamin B1
Vit. B1
Vitamin B2
Vit. B2
Vitamin B3
Vit. B3
Vitamin B5
Vit. B5
Vitamin B6
Vit. B6
Vitamin B12
Vit. B12
Vitamin K
Vit. K
Folate
Folate
0%
23%
0%
4.4%
158%
69%
96%
67%
122%
250%
4%
1.5%
4
100 g
300 g
1 slice round - 12.3g
Vitamin C
Vit. C
Vitamin D
Vit. D
Vitamin A
Vit. A
Vitamin E
Vit. E
Vitamin B1
Vit. B1
Vitamin B2
Vit. B2
Vitamin B3
Vit. B3
Vitamin B5
Vit. B5
Vitamin B6
Vit. B6
Vitamin B12
Vit. B12
Vitamin K
Vit. K
Folate
Folate
0%
15%
0%
4.4%
92%
82%
113%
72%
106%
190%
8%
2.3%
All nutrients comparison - raw data values
Nutrient
DV% diff.
Manganese
0.04mg
0.978mg
41%
Copper
0.08mg
0.357mg
31%
Saturated fat
14.38g
9.316g
23%
Sodium
1235mg
1740mg
22%
Vitamin B1
0.63mg
0.367mg
22%
Vitamin B12
2µg
1.52µg
20%
Fats
38.27g
25.9g
19%
Selenium
21.1µg
31.3µg
19%
Monounsaturated fat
18.4g
11.127g
18%
Calories
455kcal
336kcal
6%
Phosphorus
150mg
191mg
6%
Vitamin B3
5.131mg
6.053mg
6%
Polyunsaturated fat
3.46g
2.529g
6%
Protein
24.1g
21.85g
5%
Vitamin B6
0.53mg
0.459mg
5%
Zinc
3.41mg
2.93mg
4%
Vitamin B2
0.3mg
0.357mg
4%
Vitamin D*
61 IU
41 IU
3%
Vitamin D
1.5µg
1µg
3%
Potassium
398mg
316mg
2%
Vitamin B5
1.12mg
1.201mg
2%
Calcium
8mg
15mg
1%
Vitamin K
1.6µg
3.2µg
1%
Choline
96.7mg
93.5mg
1%
Protein per 100 calories
5.3g
6.5g
N/A
Calories per 10 g protein
189kcal
154kcal
N/A
Weight per 100 calories
22g
30g
N/A
Unsaturated / Saturated Fat ratio
1.5
1.5
N/A
Net carbs
1.86g
2.4g
N/A
Carbs
1.86g
2.4g
0%
Cholesterol
88mg
89mg
0%
Magnesium
18mg
19mg
0%
Iron
1.59mg
1.56mg
0%
Sugar
0g
0.96g
N/A
Vitamin E
0.22mg
0.22mg
0%
Folate
2µg
3µg
0%
Trans fat
0.586g
N/A
Tryptophan
0.278mg
0.114mg
0%
Threonine
1.473mg
0.521mg
0%
Isoleucine
2.206mg
0.675mg
0%
Leucine
1.708mg
0.929mg
0%
Lysine
2.414mg
1.107mg
0%
Methionine
0.47mg
0.301mg
0%
Phenylalanine
1.149mg
0.481mg
0%
Valine
0.914mg
0.668mg
0%
Histidine
0.721mg
0.359mg
0%
Omega-3 - ALA
0.126g
N/A
Omega-6 - Eicosadienoic acid
0.084g
N/A
Omega-6 - Linoleic acid
2.104g
N/A
Macronutrient Comparison
Macronutrient breakdown side-by-side comparison
2
24%
38%
2%
32%
4%
Protein:
24.1 g
Fats:
38.27 g
Carbs:
1.86 g
Water:
31.85 g
Other:
3.92 g
3
22%
26%
2%
45%
5%
Protein:
21.85 g
Fats:
25.9 g
Carbs:
2.4 g
Water:
45.19 g
Other:
4.66 g
Contains
more
Fats Fats
+47.8%
Contains
more
Carbs Carbs
+29%
Contains
more
Water Water
+41.9%
Contains
more
Other Other
+18.9%
~equal in
Protein
~21.85g
Fat Type Comparison
Fat type breakdown side-by-side comparison
2
40%
51%
10%
Saturated fat:
Sat. Fat
14.38 g
Monounsaturated fat:
Mono. Fat
18.4 g
Polyunsaturated fat:
Poly. Fat
3.46 g
1
41%
48%
11%
Saturated fat:
Sat. Fat
9.316 g
Monounsaturated fat:
Mono. Fat
11.127 g
Polyunsaturated fat:
Poly. Fat
2.529 g
Contains
more
Mono. Fat Monounsaturated fat
+65.4%
Contains
more
Poly. Fat Polyunsaturated fat
+36.8%
Contains
less
Sat. Fat Saturated fat
-35.2%