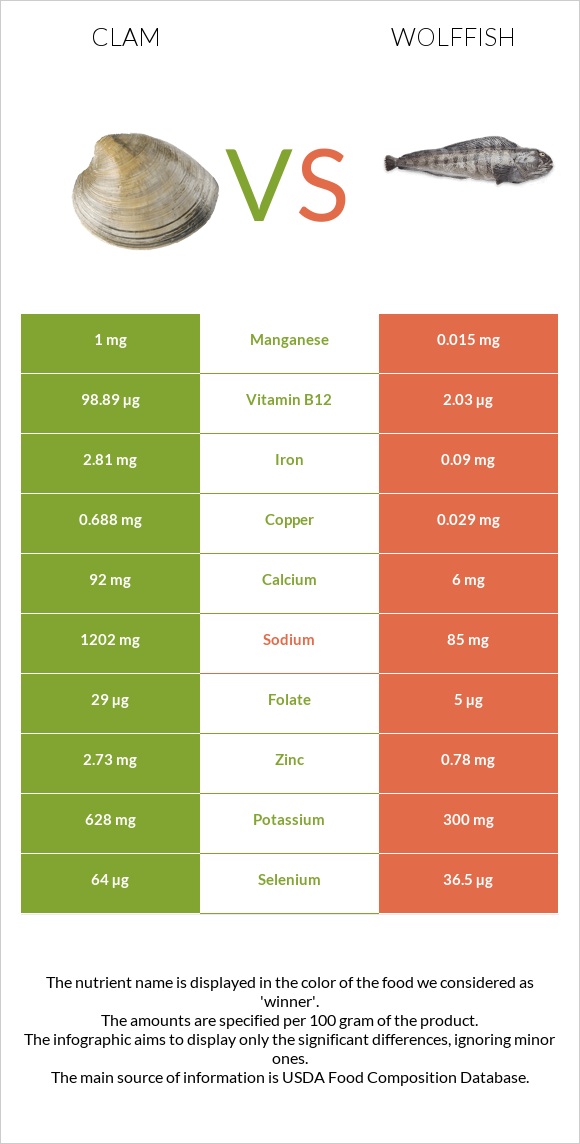
Summary of differences between clam and wolffish Clam has more vitamin B12, copper, manganese, iron, selenium, vitamin B2, vitamin C, and zinc; however, wolffish is higher in vitamin B6. Clam covers your daily need for vitamin B12, 4023% more than wolffish. Wolffish has less sodium. The glycemic index of clam is higher. These are the specific foods used in this comparison Mollusks, clam, mixed species, cooked, moist heat and Fish, wolffish, Atlantic, cooked, dry heat .
Infographic
Mineral Comparison
Mineral comparison score is based on the number of minerals by which one or the other food is richer. The "coverage" charts below show how much of the daily needs can be covered by 300 grams of the food.
8
100 g
300 g
3 oz - 85g 20 small - 190g
Magnesium
Magnesium
Calcium
Calcium
Potassium
Potassium
Iron
Iron
Copper
Copper
Zinc
Zinc
Phosphorus
Phosphorus
Sodium
Sodium
Manganese
Manganese
Selenium
Selenium
13%
28%
55%
105%
229%
74%
145%
157%
130%
349%
2
100 g
300 g
3 oz - 85g 0.5 fillet - 119g
Magnesium
Magnesium
Calcium
Calcium
Potassium
Potassium
Iron
Iron
Copper
Copper
Zinc
Zinc
Phosphorus
Phosphorus
Sodium
Sodium
Manganese
Manganese
Selenium
Selenium
27%
2.4%
34%
4.5%
12%
27%
110%
14%
2.5%
255%
Vitamin Comparison
Vitamin comparison score is based on the number of vitamins by which one or the other food is richer. The "coverage" charts below show how much of the daily needs can be covered by 300 grams of the food.
6
100 g
300 g
3 oz - 85g 20 small - 190g
Vitamin C
Vit. C
Vitamin D
Vit. D
Vitamin A
Vit. A
Vitamin E
Vit. E
Vitamin B1
Vit. B1
Vitamin B2
Vit. B2
Vitamin B3
Vit. B3
Vitamin B5
Vit. B5
Vitamin B6
Vit. B6
Vitamin B12
Vit. B12
Vitamin K
Vit. K
Folate
Folate
74%
0%
57%
0%
38%
98%
63%
41%
25%
12361%
0%
22%
2
100 g
300 g
3 oz - 85g 0.5 fillet - 119g
Vitamin C
Vit. C
Vitamin D
Vit. D
Vitamin A
Vit. A
Vitamin E
Vit. E
Vitamin B1
Vit. B1
Vitamin B2
Vit. B2
Vitamin B3
Vit. B3
Vitamin B5
Vit. B5
Vitamin B6
Vit. B6
Vitamin B12
Vit. B12
Vitamin K
Vit. K
Folate
Folate
0%
0%
43%
0%
52%
22%
49%
39%
107%
294%
0%
4.5%
All nutrients comparison - raw data values
Nutrient
DV% diff.
Vitamin B12
98.89µg
2.35µg
4023%
Copper
0.688mg
0.037mg
72%
Sodium
1202mg
109mg
48%
Manganese
1mg
0.019mg
43%
Iron
2.81mg
0.12mg
34%
Selenium
64µg
46.8µg
31%
Vitamin B6
0.11mg
0.462mg
27%
Vitamin C
22.1mg
0mg
25%
Vitamin B2
0.426mg
0.097mg
25%
Zinc
2.73mg
1mg
16%
Phosphorus
338mg
256mg
12%
Calcium
92mg
8mg
8%
Potassium
628mg
385mg
7%
Protein
25.55g
22.44g
6%
Folate
29µg
6µg
6%
Magnesium
18mg
38mg
5%
Vitamin A
171µg
130µg
5%
Vitamin B1
0.15mg
0.208mg
5%
Vitamin B3
3.354mg
2.598mg
5%
Polyunsaturated fat
0.552g
1.083g
4%
Cholesterol
67mg
59mg
3%
Fats
1.95g
3.06g
2%
Carbs
5.13g
0g
2%
Monounsaturated fat
0.172g
1.072g
2%
Calories
148kcal
123kcal
1%
Saturated fat
0.188g
0.468g
1%
Protein per 100 calories
17g
18g
N/A
Calories per 10 g protein
58kcal
55kcal
N/A
Weight per 100 calories
68g
81g
N/A
Unsaturated / Saturated Fat ratio
3.9
4.6
N/A
Net carbs
5.13g
0g
N/A
Vitamin B5
0.68mg
0.658mg
0%
Tryptophan
0.286mg
0.251mg
0%
Threonine
1.099mg
0.984mg
0%
Isoleucine
1.112mg
1.034mg
0%
Leucine
1.798mg
1.824mg
0%
Lysine
1.909mg
2.061mg
0%
Methionine
0.576mg
0.664mg
0%
Phenylalanine
0.915mg
0.876mg
0%
Valine
1.116mg
1.156mg
0%
Histidine
0.49mg
0.661mg
0%
Omega-3 - EPA
0.138g
0.393g
N/A
Omega-3 - DHA
0.146g
0.405g
N/A
Omega-3 - DPA
0.104g
0.055g
N/A
Macronutrient Comparison
Macronutrient breakdown side-by-side comparison
3
26%
2%
5%
64%
4%
Protein:
25.55 g
Fats:
1.95 g
Carbs:
5.13 g
Water:
63.64 g
Other:
3.73 g
2
22%
3%
74%
Protein:
22.44 g
Fats:
3.06 g
Carbs:
0 g
Water:
74.23 g
Other:
0.27 g
Contains
more
Protein Protein
+13.9%
Contains
more
Carbs Carbs
+∞%
Contains
more
Other Other
+1281.5%
Contains
more
Fats Fats
+56.9%
Contains
more
Water Water
+16.6%
Fat Type Comparison
Fat type breakdown side-by-side comparison
1
21%
19%
61%
Saturated fat:
Sat. Fat
0.188 g
Monounsaturated fat:
Mono. Fat
0.172 g
Polyunsaturated fat:
Poly. Fat
0.552 g
2
18%
41%
41%
Saturated fat:
Sat. Fat
0.468 g
Monounsaturated fat:
Mono. Fat
1.072 g
Polyunsaturated fat:
Poly. Fat
1.083 g
Contains
less
Sat. Fat Saturated fat
-59.8%
Contains
more
Mono. Fat Monounsaturated fat
+523.3%
Contains
more
Poly. Fat Polyunsaturated fat
+96.2%