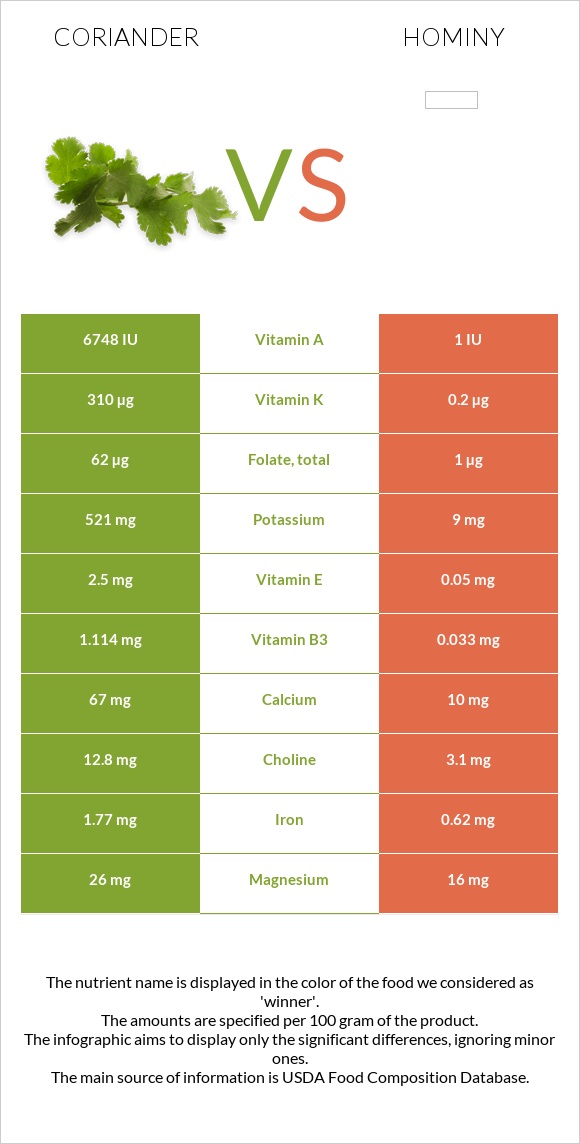
A recap on the differences between coriander and hominy Hominy has less vitamin K, vitamin A, vitamin C, copper, vitamin E, manganese, folate, potassium, and iron. Coriander covers your daily vitamin K needs 258% more than hominy. Coriander has less sodium. Food varieties used in this article are Coriander (cilantro) leaves, raw and Hominy, canned, white .
Infographic
Mineral Comparison
Mineral comparison score is based on the number of minerals by which one or the other food is richer. The "coverage" charts below show how much of the daily needs can be covered by 300 grams of the food.
8
100 g
300 g
0.25 cup - 4g 9 sprigs - 20g
Magnesium
Magnesium
Calcium
Calcium
Potassium
Potassium
Iron
Iron
Copper
Copper
Zinc
Zinc
Phosphorus
Phosphorus
Sodium
Sodium
Manganese
Manganese
Selenium
Selenium
19%
20%
46%
66%
75%
14%
21%
6%
56%
4.9%
2
100 g
300 g
1 cup - 165g
Magnesium
Magnesium
Calcium
Calcium
Potassium
Potassium
Iron
Iron
Copper
Copper
Zinc
Zinc
Phosphorus
Phosphorus
Sodium
Sodium
Manganese
Manganese
Selenium
Selenium
11%
3%
0.79%
23%
10%
29%
15%
45%
9.1%
16%
Vitamin Comparison
Vitamin comparison score is based on the number of vitamins by which one or the other food is richer. The "coverage" charts below show how much of the daily needs can be covered by 300 grams of the food.
10
100 g
300 g
0.25 cup - 4g 9 sprigs - 20g
Vitamin C
Vit. C
Vitamin D
Vit. D
Vitamin A
Vit. A
Vitamin E
Vit. E
Vitamin B1
Vit. B1
Vitamin B2
Vit. B2
Vitamin B3
Vit. B3
Vitamin B5
Vit. B5
Vitamin B6
Vit. B6
Vitamin B12
Vit. B12
Vitamin K
Vit. K
Folate
Folate
90%
0%
112%
50%
17%
37%
21%
34%
34%
0%
775%
47%
0
100 g
300 g
1 cup - 165g
Vitamin C
Vit. C
Vitamin D
Vit. D
Vitamin A
Vit. A
Vitamin E
Vit. E
Vitamin B1
Vit. B1
Vitamin B2
Vit. B2
Vitamin B3
Vit. B3
Vitamin B5
Vit. B5
Vitamin B6
Vit. B6
Vitamin B12
Vit. B12
Vitamin K
Vit. K
Folate
Folate
0%
0%
0%
1%
0.75%
1.4%
0.62%
9.2%
1.2%
0%
0.5%
0.75%
All nutrients comparison - raw data values
Nutrient
DV% diff.
Vitamin K
310µg
0.2µg
258%
Vitamin A
337µg
0µg
37%
Vitamin C
27mg
0mg
30%
Copper
0.225mg
0.03mg
22%
Vitamin E
2.5mg
0.05mg
16%
Potassium
521mg
9mg
15%
Manganese
0.426mg
0.07mg
15%
Folate
62µg
1µg
15%
Iron
1.77mg
0.62mg
14%
Sodium
46mg
345mg
13%
Vitamin B2
0.162mg
0.006mg
12%
Vitamin B6
0.149mg
0.005mg
11%
Vitamin B5
0.57mg
0.154mg
8%
Vitamin B3
1.114mg
0.033mg
7%
Calcium
67mg
10mg
6%
Zinc
0.5mg
1.05mg
5%
Vitamin B1
0.067mg
0.003mg
5%
Carbs
3.67g
14.26g
4%
Selenium
0.9µg
3µg
4%
Calories
23kcal
72kcal
2%
Magnesium
26mg
16mg
2%
Phosphorus
48mg
35mg
2%
Choline
12.8mg
3.1mg
2%
Polyunsaturated fat
0.04g
0.399g
2%
Protein
2.13g
1.48g
1%
Fats
0.52g
0.88g
1%
Fiber
2.8g
2.5g
1%
Protein per 100 calories
9.3g
2.1g
N/A
Calories per 10 g protein
108kcal
486kcal
N/A
Weight per 100 calories
435g
139g
N/A
Net carbs
0.87g
11.76g
N/A
Sugar
0.87g
1.82g
N/A
Saturated fat
0.014g
0.123g
0%
Monounsaturated fat
0.275g
0.231g
0%
Tryptophan
0.008mg
0%
Threonine
0.05mg
0%
Isoleucine
0.058mg
0%
Leucine
0.202mg
0%
Lysine
0.033mg
0%
Methionine
0.031mg
0%
Phenylalanine
0.076mg
0%
Valine
0.077mg
0%
Histidine
0.045mg
0%
Macronutrient Comparison
Macronutrient breakdown side-by-side comparison
3
2%
4%
92%
Protein:
2.13 g
Fats:
0.52 g
Carbs:
3.67 g
Water:
92.21 g
Other:
1.47 g
2
14%
83%
Protein:
1.48 g
Fats:
0.88 g
Carbs:
14.26 g
Water:
82.53 g
Other:
0.85 g
Contains
more
Protein Protein
+43.9%
Contains
more
Water Water
+11.7%
Contains
more
Other Other
+72.9%
Contains
more
Fats Fats
+69.2%
Contains
more
Carbs Carbs
+288.6%
Fat Type Comparison
Fat type breakdown side-by-side comparison
2
4%
84%
12%
Saturated fat:
Sat. Fat
0.014 g
Monounsaturated fat:
Mono. Fat
0.275 g
Polyunsaturated fat:
Poly. Fat
0.04 g
1
16%
31%
53%
Saturated fat:
Sat. Fat
0.123 g
Monounsaturated fat:
Mono. Fat
0.231 g
Polyunsaturated fat:
Poly. Fat
0.399 g
Contains
less
Sat. Fat Saturated fat
-88.6%
Contains
more
Mono. Fat Monounsaturated fat
+19%
Contains
more
Poly. Fat Polyunsaturated fat
+897.5%