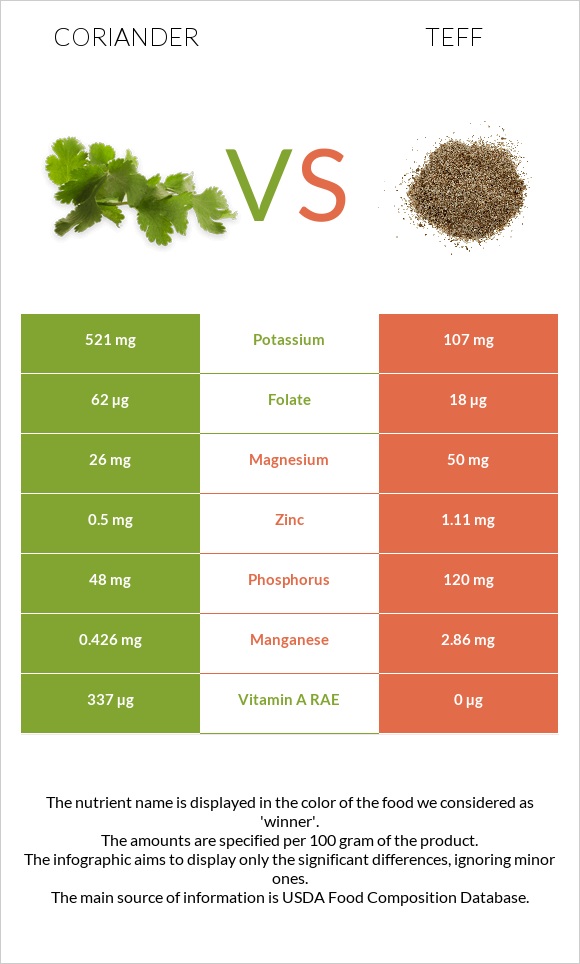
How are coriander and teff different? Coriander is richer in vitamin A, potassium, folate, and vitamin B2, while teff is higher in manganese, phosphorus, vitamin B1, magnesium, and zinc. Coriander covers your daily need for vitamin A, 135% more than teff. Coriander contains 5 times more vitamin B2 than teff. Coriander contains 0.162mg of vitamin B2, while teff contains 0.033mg. Teff has a higher glycemic index (57) than coriander (32). Coriander (cilantro) leaves, raw and Teff, cooked types were used in this article.
Infographic
Mineral Comparison
Mineral comparison score is based on the number of minerals by which one or the other food is richer. The "coverage" charts below show how much of the daily needs can be covered by 300 grams of the food.
3
100 g
300 g
0.25 cup - 4g 9 sprigs - 20g
Magnesium
Magnesium
Calcium
Calcium
Potassium
Potassium
Iron
Iron
Copper
Copper
Zinc
Zinc
Phosphorus
Phosphorus
Sodium
Sodium
Manganese
Manganese
Selenium
Selenium
19%
20%
46%
66%
75%
14%
21%
6%
56%
4.9%
6
100 g
300 g
1 cup - 252g
Magnesium
Magnesium
Calcium
Calcium
Potassium
Potassium
Iron
Iron
Copper
Copper
Zinc
Zinc
Phosphorus
Phosphorus
Sodium
Sodium
Manganese
Manganese
Selenium
Selenium
36%
15%
9.4%
77%
75%
30%
51%
1%
373%
0%
Vitamin Comparison
Vitamin comparison score is based on the number of vitamins by which one or the other food is richer. The "coverage" charts below show how much of the daily needs can be covered by 300 grams of the food.
9
100 g
300 g
0.25 cup - 4g 9 sprigs - 20g
Vitamin C
Vit. C
Vitamin D
Vit. D
Vitamin A
Vit. A
Vitamin E
Vit. E
Vitamin B1
Vit. B1
Vitamin B2
Vit. B2
Vitamin B3
Vit. B3
Vitamin B5
Vit. B5
Vitamin B6
Vit. B6
Vitamin B12
Vit. B12
Vitamin K
Vit. K
Folate
Folate
90%
0%
112%
50%
17%
37%
21%
34%
34%
0%
775%
47%
1
100 g
300 g
1 cup - 252g
Vitamin C
Vit. C
Vitamin D
Vit. D
Vitamin A
Vit. A
Vitamin E
Vit. E
Vitamin B1
Vit. B1
Vitamin B2
Vit. B2
Vitamin B3
Vit. B3
Vitamin B5
Vit. B5
Vitamin B6
Vit. B6
Vitamin B12
Vit. B12
Vitamin K
Vit. K
Folate
Folate
0%
0%
0%
0%
46%
7.6%
17%
0%
22%
0%
0%
14%
All nutrients comparison - raw data values
Nutrient
DV% diff.
Vitamin K
310µg
258%
Manganese
0.426mg
2.86mg
106%
Vitamin A
337µg
0µg
37%
Vitamin C
27mg
30%
Vitamin E
2.5mg
17%
Potassium
521mg
107mg
12%
Vitamin B5
0.57mg
11%
Folate
62µg
18µg
11%
Phosphorus
48mg
120mg
10%
Vitamin B1
0.067mg
0.183mg
10%
Vitamin B2
0.162mg
0.033mg
10%
Magnesium
26mg
50mg
6%
Zinc
0.5mg
1.11mg
6%
Carbs
3.67g
19.86g
5%
Calories
23kcal
101kcal
4%
Iron
1.77mg
2.05mg
4%
Vitamin B6
0.149mg
0.097mg
4%
Protein
2.13g
3.87g
3%
Calcium
67mg
49mg
2%
Sodium
46mg
8mg
2%
Selenium
0.9µg
2%
Choline
12.8mg
2%
Vitamin B3
1.114mg
0.909mg
1%
Monounsaturated fat
0.275g
1%
Protein per 100 calories
9.3g
3.8g
N/A
Calories per 10 g protein
108kcal
261kcal
N/A
Weight per 100 calories
435g
99g
N/A
Fats
0.52g
0.65g
0%
Net carbs
0.87g
17.06g
N/A
Sugar
0.87g
N/A
Fiber
2.8g
2.8g
0%
Copper
0.225mg
0.226mg
0%
Saturated fat
0.014g
0%
Polyunsaturated fat
0.04g
0%
Tryptophan
0.041mg
0%
Threonine
0.149mg
0%
Isoleucine
0.146mg
0%
Leucine
0.311mg
0%
Lysine
0.109mg
0%
Methionine
0.125mg
0%
Phenylalanine
0.203mg
0%
Valine
0.2mg
0%
Histidine
0.088mg
0%
Macronutrient Comparison
Macronutrient breakdown side-by-side comparison
2
2%
4%
92%
Protein:
2.13 g
Fats:
0.52 g
Carbs:
3.67 g
Water:
92.21 g
Other:
1.47 g
3
4%
20%
75%
Protein:
3.87 g
Fats:
0.65 g
Carbs:
19.86 g
Water:
74.93 g
Other:
0.69 g
Contains
more
Water Water
+23.1%
Contains
more
Other Other
+113%
Contains
more
Protein Protein
+81.7%
Contains
more
Fats Fats
+25%
Contains
more
Carbs Carbs
+441.1%