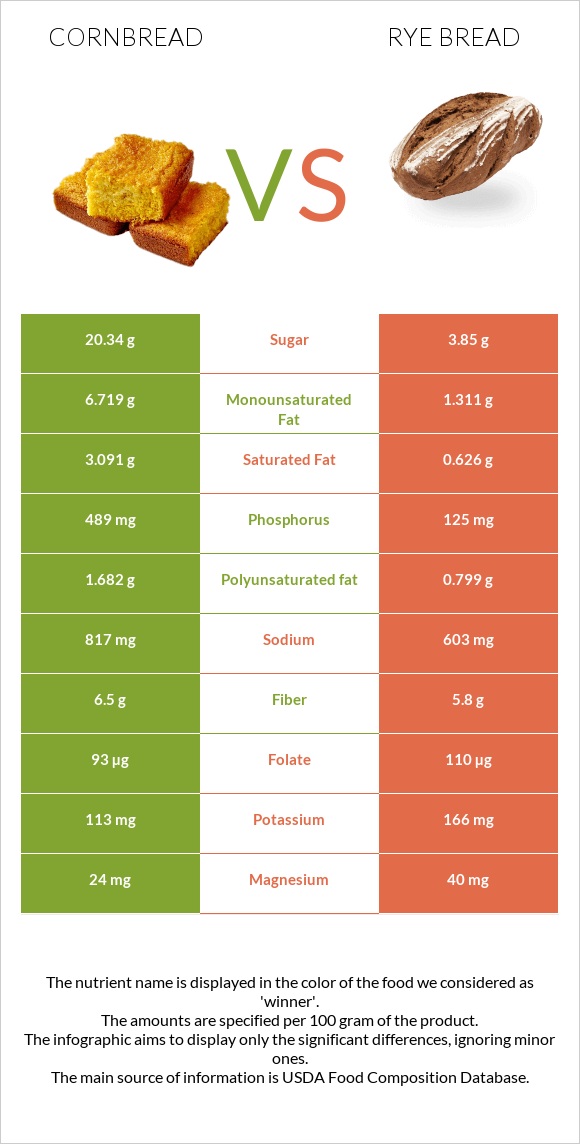
Summary of differences between cornbread and rye bread Cornbread has more phosphorus, while rye bread has more selenium, manganese, vitamin B1, fiber, folate, copper, and vitamin B2. Rye bread covers your daily need for selenium, 40% more than cornbread. Rye bread has a lower glycemic index. The glycemic index of rye bread is 60, while the glycemic index of cornbread is 76. These are the specific foods used in this comparison Bread, cornbread, dry mix, prepared with 2% milk, 80% margarine, and eggs and Bread, rye .
Infographic
Mineral Comparison
Mineral comparison score is based on the number of minerals by which one or the other food is richer. The "coverage" charts below show how much of the daily needs can be covered by 300 grams of the food.
2
100 g
300 g
1 oz - 28.35g 1 muffin - 51g 1 piece - 60g
Magnesium
Magnesium
Calcium
Calcium
Potassium
Potassium
Iron
Iron
Copper
Copper
Zinc
Zinc
Phosphorus
Phosphorus
Sodium
Sodium
Manganese
Manganese
Selenium
Selenium
12%
41%
12%
69%
24%
18%
168%
78%
29%
47%
7
100 g
300 g
1 slice, snack-size - 7g 1 slice, thin - 25g 1 oz - 28.35g 1 slice, regular - 32g
Magnesium
Magnesium
Calcium
Calcium
Potassium
Potassium
Iron
Iron
Copper
Copper
Zinc
Zinc
Phosphorus
Phosphorus
Sodium
Sodium
Manganese
Manganese
Selenium
Selenium
29%
22%
15%
106%
62%
31%
54%
79%
107%
169%
Vitamin Comparison
Vitamin comparison score is based on the number of vitamins by which one or the other food is richer. The "coverage" charts below show how much of the daily needs can be covered by 300 grams of the food.
6
100 g
300 g
1 oz - 28.35g 1 muffin - 51g 1 piece - 60g
Vitamin C
Vit. C
Vitamin D
Vit. D
Vitamin A
Vit. A
Vitamin E
Vit. E
Vitamin B1
Vit. B1
Vitamin B2
Vit. B2
Vitamin B3
Vit. B3
Vitamin B5
Vit. B5
Vitamin B6
Vit. B6
Vitamin B12
Vit. B12
Vitamin K
Vit. K
Folate
Folate
0.33%
0%
12%
10%
48%
40%
38%
35%
20%
29%
9.3%
41%
5
100 g
300 g
1 slice, snack-size - 7g 1 slice, thin - 25g 1 oz - 28.35g 1 slice, regular - 32g
Vitamin C
Vit. C
Vitamin D
Vit. D
Vitamin A
Vit. A
Vitamin E
Vit. E
Vitamin B1
Vit. B1
Vitamin B2
Vit. B2
Vitamin B3
Vit. B3
Vitamin B5
Vit. B5
Vitamin B6
Vit. B6
Vitamin B12
Vit. B12
Vitamin K
Vit. K
Folate
Folate
1.3%
0%
0%
6.6%
109%
77%
71%
26%
17%
0%
3%
83%
All nutrients comparison - raw data values
Nutrient
DV% diff.
Selenium
8.7µg
30.9µg
40%
Phosphorus
391mg
125mg
38%
Manganese
0.222mg
0.824mg
26%
Vitamin B1
0.19mg
0.434mg
20%
Cholesterol
57mg
0mg
19%
Starch
35.66g
15%
Fiber
2.3g
5.8g
14%
Folate
55µg
110µg
14%
Saturated fat
3.732g
0.626g
14%
Copper
0.073mg
0.186mg
13%
Iron
1.85mg
2.83mg
12%
Vitamin B2
0.175mg
0.335mg
12%
Vitamin B3
2.004mg
3.805mg
11%
Fats
9.58g
3.3g
10%
Vitamin B12
0.23µg
0µg
10%
Choline
58.7mg
14.6mg
8%
Polyunsaturated fat
1.963g
0.799g
8%
Calcium
135mg
73mg
6%
Magnesium
17mg
40mg
5%
Monounsaturated fat
3.494g
1.311g
5%
Calories
330kcal
259kcal
4%
Protein
6.59g
8.5g
4%
Zinc
0.67mg
1.14mg
4%
Vitamin A
35µg
0µg
4%
Vitamin B5
0.579mg
0.44mg
3%
Carbs
54.46g
48.3g
2%
Vitamin K
3.7µg
1.2µg
2%
Potassium
133mg
166mg
1%
Vitamin E
0.51mg
0.33mg
1%
Vitamin B6
0.085mg
0.075mg
1%
Protein per 100 calories
2g
3.3g
N/A
Calories per 10 g protein
501kcal
305kcal
N/A
Weight per 100 calories
30g
39g
N/A
Unsaturated / Saturated Fat ratio
1.5
3.4
N/A
Vitamin C
0.1mg
0.4mg
0%
Net carbs
52.16g
42.5g
N/A
Sugar
16.05g
3.85g
N/A
Sodium
599mg
603mg
0%
Trans fat
0.224g
N/A
Tryptophan
0.059mg
0.096mg
0%
Threonine
0.226mg
0.255mg
0%
Isoleucine
0.265mg
0.319mg
0%
Leucine
0.658mg
0.579mg
0%
Lysine
0.324mg
0.233mg
0%
Methionine
0.157mg
0.139mg
0%
Phenylalanine
0.343mg
0.411mg
0%
Valine
0.334mg
0.379mg
0%
Histidine
0.167mg
0.182mg
0%
Fructose
0.2g
0%
Omega-3 - DHA
0.007g
0g
N/A
Omega-3 - ALA
0.076g
N/A
Omega-3 - DPA
0.003g
0g
N/A
Omega-3 - Eicosatrienoic acid
0.004g
N/A
Omega-6 - Gamma-linoleic acid
0.004g
N/A
Omega-6 - Dihomo-gamma-linoleic acid
0.009g
N/A
Omega-6 - Eicosadienoic acid
0.043g
N/A
Omega-6 - Linoleic acid
1.726g
N/A
Macronutrient Comparison
Macronutrient breakdown side-by-side comparison
2
7%
10%
54%
27%
2%
Protein:
6.59 g
Fats:
9.58 g
Carbs:
54.46 g
Water:
27.11 g
Other:
2.26 g
3
9%
3%
48%
37%
3%
Protein:
8.5 g
Fats:
3.3 g
Carbs:
48.3 g
Water:
37.3 g
Other:
2.6 g
Contains
more
Fats Fats
+190.3%
Contains
more
Carbs Carbs
+12.8%
Contains
more
Protein Protein
+29%
Contains
more
Water Water
+37.6%
Contains
more
Other Other
+15%
Fat Type Comparison
Fat type breakdown side-by-side comparison
2
41%
38%
21%
Saturated fat:
Sat. Fat
3.732 g
Monounsaturated fat:
Mono. Fat
3.494 g
Polyunsaturated fat:
Poly. Fat
1.963 g
1
23%
48%
29%
Saturated fat:
Sat. Fat
0.626 g
Monounsaturated fat:
Mono. Fat
1.311 g
Polyunsaturated fat:
Poly. Fat
0.799 g
Contains
more
Mono. Fat Monounsaturated fat
+166.5%
Contains
more
Poly. Fat Polyunsaturated fat
+145.7%
Contains
less
Sat. Fat Saturated fat
-83.2%