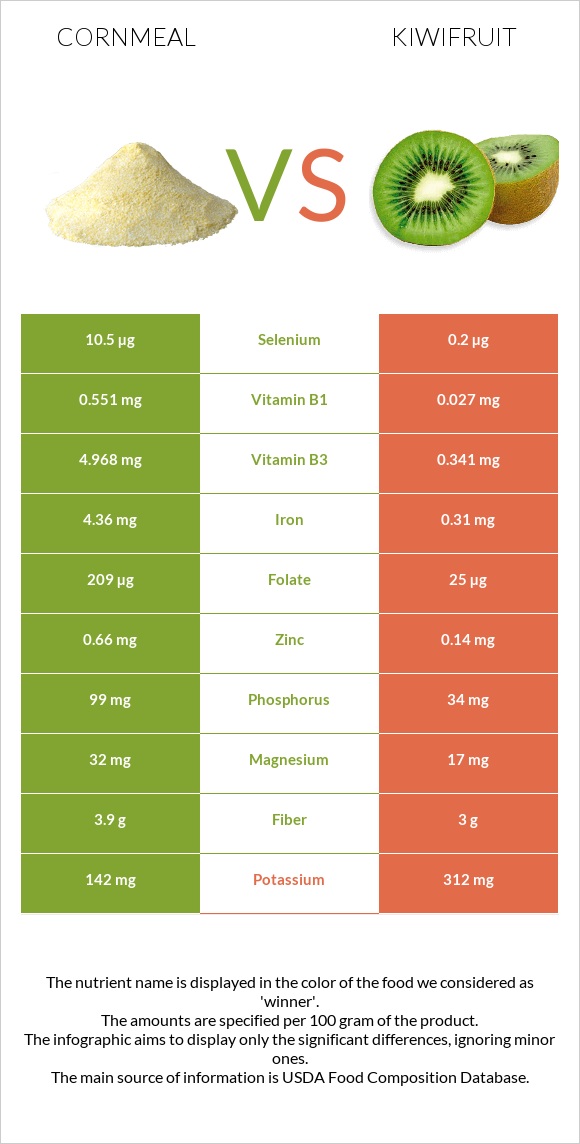
Significant differences between cornmeal and kiwi Cornmeal has more iron, folate, vitamin B1, vitamin B3, vitamin B2, selenium, phosphorus, and vitamin B6; however, kiwi is richer in vitamin C and vitamin K. Kiwi covers your daily vitamin C needs 103% more than cornmeal. Kiwi has 53 times less selenium than cornmeal. Cornmeal has 10.5µg of selenium, while kiwi has 0.2µg. Specific food types used in this comparison are Cornmeal, degermed, enriched, yellow and Kiwifruit, green, raw .
Infographic
Mineral Comparison
Mineral comparison score is based on the number of minerals by which one or the other food is richer. The "coverage" charts below show how much of the daily needs can be covered by 300 grams of the food.
6
100 g
300 g
1 cup - 157g
Magnesium
Magnesium
Calcium
Calcium
Potassium
Potassium
Iron
Iron
Copper
Copper
Zinc
Zinc
Phosphorus
Phosphorus
Sodium
Sodium
Manganese
Manganese
Selenium
Selenium
23%
0.9%
13%
164%
25%
18%
42%
0.91%
23%
57%
4
100 g
300 g
1 fruit (2" dia) - 69g 1 NLEA serving - 148g 1 cup, sliced - 180g
Magnesium
Magnesium
Calcium
Calcium
Potassium
Potassium
Iron
Iron
Copper
Copper
Zinc
Zinc
Phosphorus
Phosphorus
Sodium
Sodium
Manganese
Manganese
Selenium
Selenium
12%
10%
28%
12%
43%
3.8%
15%
0.39%
13%
1.1%
Vitamin Comparison
Vitamin comparison score is based on the number of vitamins by which one or the other food is richer. The "coverage" charts below show how much of the daily needs can be covered by 300 grams of the food.
7
100 g
300 g
1 cup - 157g
Vitamin C
Vit. C
Vitamin D
Vit. D
Vitamin A
Vit. A
Vitamin E
Vit. E
Vitamin B1
Vit. B1
Vitamin B2
Vit. B2
Vitamin B3
Vit. B3
Vitamin B5
Vit. B5
Vitamin B6
Vit. B6
Vitamin B12
Vit. B12
Vitamin K
Vit. K
Folate
Folate
0%
0%
3.7%
2.4%
138%
88%
93%
14%
42%
0%
0%
157%
3
100 g
300 g
1 fruit (2" dia) - 69g 1 NLEA serving - 148g 1 cup, sliced - 180g
Vitamin C
Vit. C
Vitamin D
Vit. D
Vitamin A
Vit. A
Vitamin E
Vit. E
Vitamin B1
Vit. B1
Vitamin B2
Vit. B2
Vitamin B3
Vit. B3
Vitamin B5
Vit. B5
Vitamin B6
Vit. B6
Vitamin B12
Vit. B12
Vitamin K
Vit. K
Folate
Folate
309%
0%
1.3%
29%
6.8%
5.8%
6.4%
11%
15%
0%
101%
19%
All nutrients comparison - raw data values
Nutrient
DV% diff.
Vitamin C
0mg
92.7mg
103%
Iron
4.36mg
0.31mg
51%
Folate
209µg
25µg
46%
Vitamin B1
0.551mg
0.027mg
44%
Vitamin K
0µg
40.3µg
34%
Starch
73.3g
0g
30%
Vitamin B3
4.968mg
0.341mg
29%
Vitamin B2
0.382mg
0.025mg
27%
Carbs
79.45g
14.66g
22%
Selenium
10.5µg
0.2µg
19%
Calories
370kcal
61kcal
15%
Protein
7.11g
1.14g
12%
Phosphorus
99mg
34mg
9%
Vitamin E
0.12mg
1.46mg
9%
Vitamin B6
0.182mg
0.063mg
9%
Copper
0.076mg
0.13mg
6%
Potassium
142mg
312mg
5%
Zinc
0.66mg
0.14mg
5%
Fructose
0.17g
4.35g
5%
Magnesium
32mg
17mg
4%
Fiber
3.9g
3g
4%
Polyunsaturated fat
0.828g
0.287g
4%
Calcium
3mg
34mg
3%
Manganese
0.174mg
0.098mg
3%
Fats
1.75g
0.52g
2%
Vitamin A
11µg
4µg
1%
Vitamin B5
0.24mg
0.183mg
1%
Saturated fat
0.22g
0.029g
1%
Monounsaturated fat
0.39g
0.047g
1%
Protein per 100 calories
1.9g
1.9g
N/A
Calories per 10 g protein
520kcal
535kcal
N/A
Weight per 100 calories
27g
164g
N/A
Net carbs
75.55g
11.66g
N/A
Sugar
1.61g
8.99g
N/A
Sodium
7mg
3mg
0%
Choline
8.6mg
7.8mg
0%
Tryptophan
0.038mg
0.015mg
0%
Threonine
0.172mg
0.047mg
0%
Isoleucine
0.242mg
0.051mg
0%
Leucine
1.006mg
0.066mg
0%
Lysine
0.105mg
0.061mg
0%
Methionine
0.162mg
0.024mg
0%
Phenylalanine
0.366mg
0.044mg
0%
Valine
0.337mg
0.057mg
0%
Histidine
0.172mg
0.027mg
0%
Macronutrient Comparison
Macronutrient breakdown side-by-side comparison
3
7%
2%
79%
11%
Protein:
7.11 g
Fats:
1.75 g
Carbs:
79.45 g
Water:
11.18 g
Other:
0.51 g
2
15%
83%
Protein:
1.14 g
Fats:
0.52 g
Carbs:
14.66 g
Water:
83.07 g
Other:
0.61 g
Contains
more
Protein Protein
+523.7%
Contains
more
Fats Fats
+236.5%
Contains
more
Carbs Carbs
+442%
Contains
more
Water Water
+643%
Contains
more
Other Other
+19.6%
Fat Type Comparison
Fat type breakdown side-by-side comparison
2
15%
27%
58%
Saturated fat:
Sat. Fat
0.22 g
Monounsaturated fat:
Mono. Fat
0.39 g
Polyunsaturated fat:
Poly. Fat
0.828 g
1
8%
13%
79%
Saturated fat:
Sat. Fat
0.029 g
Monounsaturated fat:
Mono. Fat
0.047 g
Polyunsaturated fat:
Poly. Fat
0.287 g
Contains
more
Mono. Fat Monounsaturated fat
+729.8%
Contains
more
Poly. Fat Polyunsaturated fat
+188.5%
Contains
less
Sat. Fat Saturated fat
-86.8%
Carbohydrate type comparison
Carbohydrate type breakdown side-by-side comparison
2
98%
Starch:
73.3 g
Sucrose:
0.68 g
Glucose:
0.56 g
Fructose:
0.17 g
Lactose:
0 g
Maltose:
0.19 g
Galactose:
0 g
3
2%
46%
48%
2%
2%
Starch:
0 g
Sucrose:
0.15 g
Glucose:
4.11 g
Fructose:
4.35 g
Lactose:
0 g
Maltose:
0.19 g
Galactose:
0.17 g
Contains
more
Starch Starch
+∞%
Contains
more
Sucrose Sucrose
+353.3%
Contains
more
Glucose Glucose
+633.9%
Contains
more
Fructose Fructose
+2458.8%
Contains
more
Galactose Galactose
+∞%
~equal in
Lactose
~0g
~equal in
Maltose
~0.19g