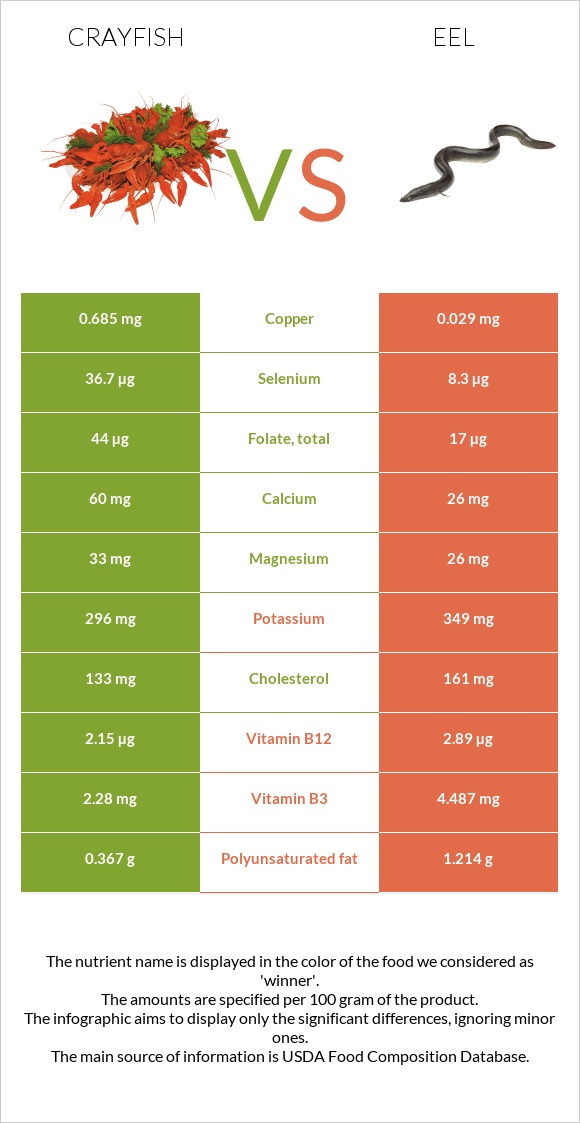
Important differences between crayfish and eels Crayfish has more copper, selenium, manganese, and folate; however, eels have more vitamin A, vitamin B12, vitamin B3, and vitamin B1. Eels' daily need coverage for vitamin A is 75% more. Crayfish has 24 times more copper than eels. Crayfish has 0.685mg of copper, while eels have 0.029mg. Crayfish is lower in cholesterol. The food varieties used in the comparison are Crustaceans, crayfish, mixed species, wild, cooked, moist heat and Fish, eel, mixed species, cooked, dry heat .
Infographic
Mineral Comparison
Mineral comparison score is based on the number of minerals by which one or the other food is richer. The "coverage" charts below show how much of the daily needs can be covered by 300 grams of the food.
6
100 g
300 g
3 oz - 85g
Magnesium
Magnesium
Calcium
Calcium
Potassium
Potassium
Iron
Iron
Copper
Copper
Zinc
Zinc
Phosphorus
Phosphorus
Sodium
Sodium
Manganese
Manganese
Selenium
Selenium
24%
18%
26%
31%
228%
48%
116%
12%
68%
200%
3
100 g
300 g
1 cubic inch, boneless - 17g 1 oz with bone (yield after bone removed) - 22g 1 oz, boneless - 28.35g 3 oz - 85g 1 fillet - 159g
Magnesium
Magnesium
Calcium
Calcium
Potassium
Potassium
Iron
Iron
Copper
Copper
Zinc
Zinc
Phosphorus
Phosphorus
Sodium
Sodium
Manganese
Manganese
Selenium
Selenium
19%
7.8%
31%
24%
9.7%
57%
119%
8.5%
5.2%
45%
Vitamin Comparison
Vitamin comparison score is based on the number of vitamins by which one or the other food is richer. The "coverage" charts below show how much of the daily needs can be covered by 300 grams of the food.
5
100 g
300 g
3 oz - 85g
Vitamin C
Vit. C
Vitamin D
Vit. D
Vitamin A
Vit. A
Vitamin E
Vit. E
Vitamin B1
Vit. B1
Vitamin B2
Vit. B2
Vitamin B3
Vit. B3
Vitamin B5
Vit. B5
Vitamin B6
Vit. B6
Vitamin B12
Vit. B12
Vitamin K
Vit. K
Folate
Folate
3%
0%
5%
30%
13%
20%
43%
35%
18%
269%
0.25%
33%
5
100 g
300 g
1 cubic inch, boneless - 17g 1 oz with bone (yield after bone removed) - 22g 1 oz, boneless - 28.35g 3 oz - 85g 1 fillet - 159g
Vitamin C
Vit. C
Vitamin D
Vit. D
Vitamin A
Vit. A
Vitamin E
Vit. E
Vitamin B1
Vit. B1
Vitamin B2
Vit. B2
Vitamin B3
Vit. B3
Vitamin B5
Vit. B5
Vitamin B6
Vit. B6
Vitamin B12
Vit. B12
Vitamin K
Vit. K
Folate
Folate
6%
0%
379%
0%
46%
12%
84%
17%
18%
361%
0%
13%
All nutrients comparison - raw data values
Nutrient
DV% diff.
Vitamin A
15µg
1137µg
125%
Copper
0.685mg
0.029mg
73%
Selenium
36.7µg
8.3µg
52%
Vitamin B12
2.15µg
2.89µg
31%
Monounsaturated fat
0.244g
9.218g
22%
Fats
1.2g
14.95g
21%
Manganese
0.522mg
0.04mg
21%
Choline
80.9mg
15%
Protein
16.77g
23.65g
14%
Vitamin B3
2.28mg
4.487mg
14%
Saturated fat
0.181g
3.023g
13%
Vitamin B1
0.05mg
0.183mg
11%
Vitamin E
1.5mg
10%
Cholesterol
133mg
161mg
9%
Calories
82kcal
236kcal
8%
Folate
44µg
17µg
7%
Vitamin B5
0.58mg
0.28mg
6%
Polyunsaturated fat
0.367g
1.214g
6%
Calcium
60mg
26mg
3%
Zinc
1.76mg
2.08mg
3%
Vitamin B2
0.085mg
0.051mg
3%
Magnesium
33mg
26mg
2%
Potassium
296mg
349mg
2%
Iron
0.83mg
0.64mg
2%
Vitamin C
0.9mg
1.8mg
1%
Phosphorus
270mg
277mg
1%
Sodium
94mg
65mg
1%
Protein per 100 calories
20g
10g
N/A
Calories per 10 g protein
49kcal
100kcal
N/A
Weight per 100 calories
122g
42g
N/A
Unsaturated / Saturated Fat ratio
3.4
3.5
N/A
Vitamin B6
0.076mg
0.077mg
0%
Vitamin K
0.1µg
0%
Tryptophan
0.234mg
0.265mg
0%
Threonine
0.676mg
1.037mg
0%
Isoleucine
0.811mg
1.09mg
0%
Leucine
1.329mg
1.922mg
0%
Lysine
1.457mg
2.171mg
0%
Methionine
0.472mg
0.7mg
0%
Phenylalanine
0.706mg
0.923mg
0%
Valine
0.786mg
1.218mg
0%
Histidine
0.341mg
0.696mg
0%
Omega-3 - EPA
0.119g
0.108g
N/A
Omega-3 - DHA
0.047g
0.081g
N/A
Omega-3 - DPA
0g
0.095g
N/A
Macronutrient Comparison
Macronutrient breakdown side-by-side comparison
2
17%
79%
3%
Protein:
16.77 g
Fats:
1.2 g
Carbs:
0 g
Water:
79.37 g
Other:
2.66 g
2
24%
15%
59%
2%
Protein:
23.65 g
Fats:
14.95 g
Carbs:
0 g
Water:
59.31 g
Other:
2.09 g
Contains
more
Water Water
+33.8%
Contains
more
Other Other
+27.3%
Contains
more
Protein Protein
+41%
Contains
more
Fats Fats
+1145.8%
Fat Type Comparison
Fat type breakdown side-by-side comparison
1
23%
31%
46%
Saturated fat:
Sat. Fat
0.181 g
Monounsaturated fat:
Mono. Fat
0.244 g
Polyunsaturated fat:
Poly. Fat
0.367 g
2
22%
69%
9%
Saturated fat:
Sat. Fat
3.023 g
Monounsaturated fat:
Mono. Fat
9.218 g
Polyunsaturated fat:
Poly. Fat
1.214 g
Contains
less
Sat. Fat Saturated fat
-94%
Contains
more
Mono. Fat Monounsaturated fat
+3677.9%
Contains
more
Poly. Fat Polyunsaturated fat
+230.8%