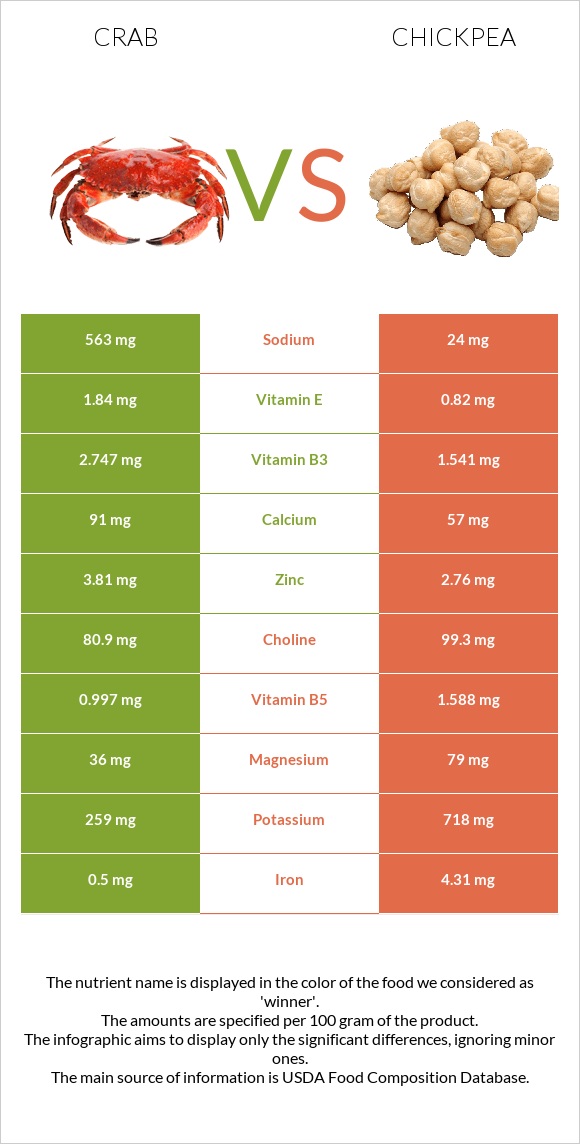
How are crab and chickpeas different? Crab is richer in vitamin B12, selenium, copper, and zinc, while chickpeas are higher in manganese, fiber, folate, and iron. Crab covers your daily need for vitamin B12, 139% more than chickpeas. Chickpeas have a higher glycemic index (36) than crab (0). Crustaceans, crab, blue, canned and Chickpeas (garbanzo beans, bengal gram), mature seeds, cooked, boiled, without salt types were used in this article.
Infographic
Mineral Comparison
Mineral comparison score is based on the number of minerals by which one or the other food is richer. The "coverage" charts below show how much of the daily needs can be covered by 300 grams of the food.
5
100 g
300 g
1 oz - 28.35g 3 oz - 85g 1 can (6.5 oz), drained - 125g 1 cup - 135g
Magnesium
Magnesium
Calcium
Calcium
Potassium
Potassium
Iron
Iron
Copper
Copper
Zinc
Zinc
Phosphorus
Phosphorus
Sodium
Sodium
Manganese
Manganese
Selenium
Selenium
26%
27%
23%
19%
271%
104%
100%
73%
9.7%
234%
5
100 g
300 g
1 cup - 164g
Magnesium
Magnesium
Calcium
Calcium
Potassium
Potassium
Iron
Iron
Copper
Copper
Zinc
Zinc
Phosphorus
Phosphorus
Sodium
Sodium
Manganese
Manganese
Selenium
Selenium
34%
15%
26%
108%
117%
42%
72%
0.91%
134%
20%
Vitamin Comparison
Vitamin comparison score is based on the number of vitamins by which one or the other food is richer. The "coverage" charts below show how much of the daily needs can be covered by 300 grams of the food.
7
100 g
300 g
1 oz - 28.35g 3 oz - 85g 1 can (6.5 oz), drained - 125g 1 cup - 135g
Vitamin C
Vit. C
Vitamin D
Vit. D
Vitamin A
Vit. A
Vitamin E
Vit. E
Vitamin B1
Vit. B1
Vitamin B2
Vit. B2
Vitamin B3
Vit. B3
Vitamin B5
Vit. B5
Vitamin B6
Vit. B6
Vitamin B12
Vit. B12
Vitamin K
Vit. K
Folate
Folate
11%
0%
0.33%
37%
5.8%
21%
52%
60%
36%
416%
0.75%
38%
3
100 g
300 g
1 cup - 164g
Vitamin C
Vit. C
Vitamin D
Vit. D
Vitamin A
Vit. A
Vitamin E
Vit. E
Vitamin B1
Vit. B1
Vitamin B2
Vit. B2
Vitamin B3
Vit. B3
Vitamin B5
Vit. B5
Vitamin B6
Vit. B6
Vitamin B12
Vit. B12
Vitamin K
Vit. K
Folate
Folate
4.3%
0%
0.33%
7%
29%
15%
9.9%
17%
32%
0%
10%
129%
All nutrients comparison - raw data values
Nutrient
DV% diff.
Vitamin B12
3.33µg
0µg
139%
Selenium
42.9µg
3.7µg
71%
Copper
0.814mg
0.352mg
51%
Manganese
0.074mg
1.03mg
42%
Cholesterol
97mg
0mg
32%
Iron
0.5mg
2.89mg
30%
Fiber
0g
7.6g
30%
Folate
51µg
172µg
30%
Sodium
563mg
7mg
24%
Zinc
3.81mg
1.53mg
21%
Protein
17.88g
8.86g
18%
Vitamin B3
2.747mg
0.526mg
14%
Vitamin B5
0.997mg
0.286mg
14%
Vitamin E
1.84mg
0.35mg
10%
Carbs
0g
27.42g
9%
Phosphorus
234mg
168mg
9%
Vitamin B1
0.023mg
0.116mg
8%
Choline
80.9mg
42.8mg
7%
Polyunsaturated fat
0.258g
1.156g
6%
Calories
83kcal
164kcal
4%
Calcium
91mg
49mg
4%
Fats
0.74g
2.59g
3%
Magnesium
36mg
48mg
3%
Vitamin K
0.3µg
4µg
3%
Vitamin C
3.3mg
1.3mg
2%
Vitamin B2
0.093mg
0.063mg
2%
Potassium
259mg
291mg
1%
Vitamin B6
0.156mg
0.139mg
1%
Monounsaturated fat
0.129g
0.583g
1%
Protein per 100 calories
22g
5.4g
N/A
Calories per 10 g protein
46kcal
185kcal
N/A
Weight per 100 calories
120g
61g
N/A
Unsaturated / Saturated Fat ratio
1.9
6.5
N/A
Net carbs
0g
19.82g
N/A
Sugar
0g
4.8g
N/A
Vitamin A
1µg
1µg
0%
Trans fat
0.014g
0g
N/A
Saturated fat
0.201g
0.269g
0%
Tryptophan
0.226mg
0.085mg
0%
Threonine
0.727mg
0.329mg
0%
Isoleucine
0.776mg
0.38mg
0%
Leucine
1.307mg
0.631mg
0%
Lysine
1.386mg
0.593mg
0%
Methionine
0.452mg
0.116mg
0%
Phenylalanine
0.708mg
0.475mg
0%
Valine
0.806mg
0.372mg
0%
Histidine
0.393mg
0.244mg
0%
Omega-3 - EPA
0.101g
0g
N/A
Omega-3 - DHA
0.067g
0g
N/A
Omega-3 - DPA
0.009g
0g
N/A
Omega-6 - Eicosadienoic acid
0.005g
N/A
Macronutrient Comparison
Macronutrient breakdown side-by-side comparison
3
18%
80%
2%
Protein:
17.88 g
Fats:
0.74 g
Carbs:
0 g
Water:
79.69 g
Other:
1.69 g
2
9%
3%
27%
60%
Protein:
8.86 g
Fats:
2.59 g
Carbs:
27.42 g
Water:
60.21 g
Other:
0.92 g
Contains
more
Protein Protein
+101.8%
Contains
more
Water Water
+32.4%
Contains
more
Other Other
+83.7%
Contains
more
Fats Fats
+250%
Contains
more
Carbs Carbs
+∞%
Fat Type Comparison
Fat type breakdown side-by-side comparison
1
34%
22%
44%
Saturated fat:
Sat. Fat
0.201 g
Monounsaturated fat:
Mono. Fat
0.129 g
Polyunsaturated fat:
Poly. Fat
0.258 g
2
13%
29%
58%
Saturated fat:
Sat. Fat
0.269 g
Monounsaturated fat:
Mono. Fat
0.583 g
Polyunsaturated fat:
Poly. Fat
1.156 g
Contains
less
Sat. Fat Saturated fat
-25.3%
Contains
more
Mono. Fat Monounsaturated fat
+351.9%
Contains
more
Poly. Fat Polyunsaturated fat
+348.1%