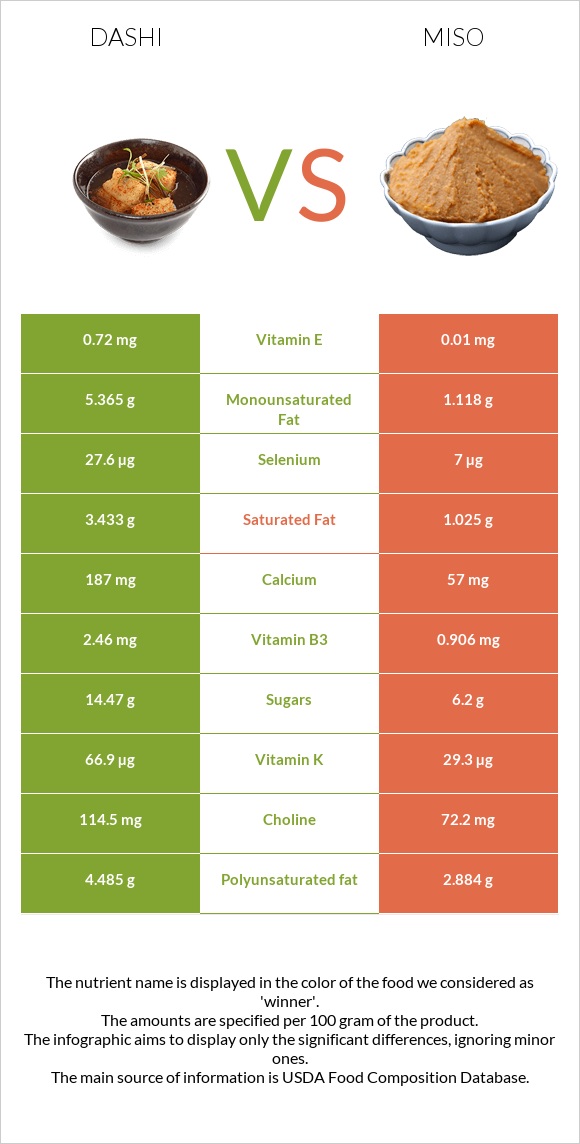
Summary of differences between dashi and miso Dashi has more selenium, vitamin K, vitamin B2, and calcium, while miso has more copper, zinc, fiber, and iron. Miso covers your daily need for sodium, 116% more than dashi. Dashi contains 4 times more selenium than miso. While dashi contains 27.6µg of selenium, miso contains only 7µg. The amount of saturated fat in miso is lower. These are the specific foods used in this comparison Soup, bouillon cubes, and granules, low sodium, dry and Miso .
Infographic
Mineral Comparison
Mineral comparison score is based on the number of minerals by which one or the other food is richer. The "coverage" charts below show how much of the daily needs can be covered by 300 grams of the food.
5
100 g
300 g
1 tsp - 2.6g 1 cube - 3.6g
Magnesium
Magnesium
Calcium
Calcium
Potassium
Potassium
Iron
Iron
Copper
Copper
Zinc
Zinc
Phosphorus
Phosphorus
Sodium
Sodium
Manganese
Manganese
Selenium
Selenium
40%
56%
27%
39%
0%
2.5%
71%
139%
0%
151%
4
100 g
300 g
1 tbsp - 17g 1 cup - 275g
Magnesium
Magnesium
Calcium
Calcium
Potassium
Potassium
Iron
Iron
Copper
Copper
Zinc
Zinc
Phosphorus
Phosphorus
Sodium
Sodium
Manganese
Manganese
Selenium
Selenium
34%
17%
19%
93%
140%
70%
68%
486%
112%
38%
Vitamin Comparison
Vitamin comparison score is based on the number of vitamins by which one or the other food is richer. The "coverage" charts below show how much of the daily needs can be covered by 300 grams of the food.
7
100 g
300 g
1 tsp - 2.6g 1 cube - 3.6g
Vitamin C
Vit. C
Vitamin D
Vit. D
Vitamin A
Vit. A
Vitamin E
Vit. E
Vitamin B1
Vit. B1
Vitamin B2
Vit. B2
Vitamin B3
Vit. B3
Vitamin B5
Vit. B5
Vitamin B6
Vit. B6
Vitamin B12
Vit. B12
Vitamin K
Vit. K
Folate
Folate
3.7%
0%
8.3%
14%
25%
99%
46%
0%
23%
38%
167%
16%
2
100 g
300 g
1 tbsp - 17g 1 cup - 275g
Vitamin C
Vit. C
Vitamin D
Vit. D
Vitamin A
Vit. A
Vitamin E
Vit. E
Vitamin B1
Vit. B1
Vitamin B2
Vit. B2
Vitamin B3
Vit. B3
Vitamin B5
Vit. B5
Vitamin B6
Vit. B6
Vitamin B12
Vit. B12
Vitamin K
Vit. K
Folate
Folate
0%
0%
1.3%
0.2%
25%
54%
17%
20%
46%
10%
73%
14%
All nutrients comparison - raw data values
Nutrient
DV% diff.
Sodium
1067mg
3728mg
116%
Copper
0mg
0.42mg
47%
Manganese
0.859mg
37%
Selenium
27.6µg
7µg
37%
Vitamin K
66.9µg
29.3µg
31%
Zinc
0.09mg
2.56mg
22%
Fiber
0.2g
5.4g
21%
Iron
1.03mg
2.49mg
18%
Vitamin B2
0.43mg
0.233mg
15%
Carbs
64.88g
25.37g
13%
Calcium
187mg
57mg
13%
Calories
438kcal
198kcal
12%
Fats
13.89g
6.01g
12%
Saturated fat
3.433g
1.025g
11%
Monounsaturated fat
5.365g
1.118g
11%
Polyunsaturated fat
4.485g
2.884g
11%
Vitamin B3
2.46mg
0.906mg
10%
Vitamin B12
0.3µg
0.08µg
9%
Protein
16.7g
12.79g
8%
Vitamin B6
0.1mg
0.199mg
8%
Choline
114.5mg
72.2mg
8%
Fructose
6g
8%
Vitamin B5
0.337mg
7%
Vitamin E
0.72mg
0.01mg
5%
Cholesterol
13mg
0mg
4%
Potassium
309mg
210mg
3%
Magnesium
56mg
48mg
2%
Vitamin A
25µg
4µg
2%
Vitamin C
1.1mg
0mg
1%
Phosphorus
166mg
159mg
1%
Folate
21µg
19µg
1%
Protein per 100 calories
3.8g
6.5g
N/A
Calories per 10 g protein
262kcal
155kcal
N/A
Weight per 100 calories
23g
51g
N/A
Unsaturated / Saturated Fat ratio
2.9
3.9
N/A
Net carbs
64.68g
19.97g
N/A
Sugar
14.47g
6.2g
N/A
Vitamin B1
0.1mg
0.098mg
0%
Tryptophan
0.155mg
0%
Threonine
0.479mg
0%
Isoleucine
0.508mg
0%
Leucine
0.82mg
0%
Lysine
0.478mg
0%
Methionine
0.129mg
0%
Phenylalanine
0.486mg
0%
Valine
0.547mg
0%
Histidine
0.243mg
0%
Macronutrient Comparison
Macronutrient breakdown side-by-side comparison
3
17%
14%
65%
2%
2%
Protein:
16.7 g
Fats:
13.89 g
Carbs:
64.88 g
Water:
2.3 g
Other:
2.23 g
2
13%
6%
25%
43%
13%
Protein:
12.79 g
Fats:
6.01 g
Carbs:
25.37 g
Water:
43.02 g
Other:
12.81 g
Contains
more
Protein Protein
+30.6%
Contains
more
Fats Fats
+131.1%
Contains
more
Carbs Carbs
+155.7%
Contains
more
Water Water
+1770.4%
Contains
more
Other Other
+474.4%
Fat Type Comparison
Fat type breakdown side-by-side comparison
2
26%
40%
34%
Saturated fat:
Sat. Fat
3.433 g
Monounsaturated fat:
Mono. Fat
5.365 g
Polyunsaturated fat:
Poly. Fat
4.485 g
1
20%
22%
57%
Saturated fat:
Sat. Fat
1.025 g
Monounsaturated fat:
Mono. Fat
1.118 g
Polyunsaturated fat:
Poly. Fat
2.884 g
Contains
more
Mono. Fat Monounsaturated fat
+379.9%
Contains
more
Poly. Fat Polyunsaturated fat
+55.5%
Contains
less
Sat. Fat Saturated fat
-70.1%