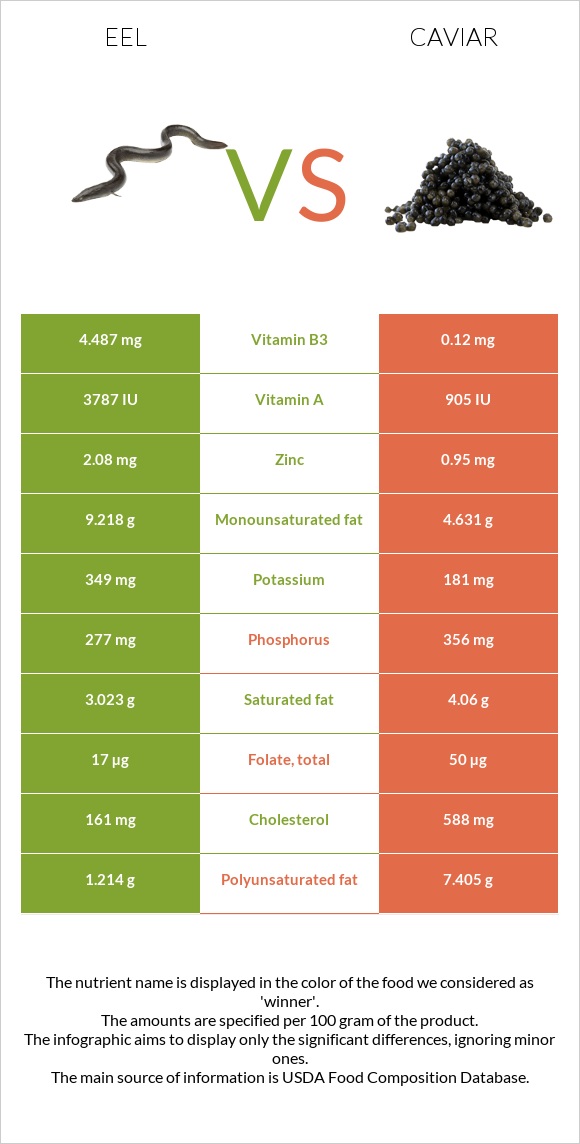
How are eels and caviar different? Eels are richer in vitamin A and vitamin B3, while caviar is higher in vitamin B12, iron, selenium, magnesium, vitamin B5, and vitamin B2. Caviar covers your daily need for vitamin B12, 713% more than eels. Eels contain 37 times more vitamin B3 than caviar. Eels contain 4.487mg of vitamin B3, while caviar contains 0.12mg. Eels are lower in cholesterol. Fish, eel, mixed species, cooked, dry heat and Fish, caviar, black, and red, granular types were used in this article.
Infographic
Mineral Comparison
Mineral comparison score is based on the number of minerals by which one or the other food is richer. The "coverage" charts below show how much of the daily needs can be covered by 300 grams of the food.
3
100 g
300 g
1 cubic inch, boneless - 17g 1 oz with bone (yield after bone removed) - 22g 1 oz, boneless - 28.35g 3 oz - 85g 1 fillet - 159g
Magnesium
Magnesium
Calcium
Calcium
Potassium
Potassium
Iron
Iron
Copper
Copper
Zinc
Zinc
Phosphorus
Phosphorus
Sodium
Sodium
Manganese
Manganese
Selenium
Selenium
19%
7.8%
31%
24%
9.7%
57%
119%
8.5%
5.2%
45%
7
100 g
300 g
1 tbsp - 16g 1 oz - 28.35g
Magnesium
Magnesium
Calcium
Calcium
Potassium
Potassium
Iron
Iron
Copper
Copper
Zinc
Zinc
Phosphorus
Phosphorus
Sodium
Sodium
Manganese
Manganese
Selenium
Selenium
214%
83%
16%
446%
37%
26%
153%
196%
6.5%
357%
Vitamin Comparison
Vitamin comparison score is based on the number of vitamins by which one or the other food is richer. The "coverage" charts below show how much of the daily needs can be covered by 300 grams of the food.
3
100 g
300 g
1 cubic inch, boneless - 17g 1 oz with bone (yield after bone removed) - 22g 1 oz, boneless - 28.35g 3 oz - 85g 1 fillet - 159g
Vitamin C
Vit. C
Vitamin D
Vit. D
Vitamin A
Vit. A
Vitamin E
Vit. E
Vitamin B1
Vit. B1
Vitamin B2
Vit. B2
Vitamin B3
Vit. B3
Vitamin B5
Vit. B5
Vitamin B6
Vit. B6
Vitamin B12
Vit. B12
Vitamin K
Vit. K
Folate
Folate
6%
0%
379%
0%
46%
12%
84%
17%
18%
361%
0%
13%
8
100 g
300 g
1 tbsp - 16g 1 oz - 28.35g
Vitamin C
Vit. C
Vitamin D
Vit. D
Vitamin A
Vit. A
Vitamin E
Vit. E
Vitamin B1
Vit. B1
Vitamin B2
Vit. B2
Vitamin B3
Vit. B3
Vitamin B5
Vit. B5
Vitamin B6
Vit. B6
Vitamin B12
Vit. B12
Vitamin K
Vit. K
Folate
Folate
0%
44%
90%
38%
48%
143%
2.3%
210%
74%
2500%
1.5%
38%
All nutrients comparison - raw data values
Nutrient
DV% diff.
Vitamin B12
2.89µg
20µg
713%
Cholesterol
161mg
588mg
142%
Iron
0.64mg
11.88mg
141%
Selenium
8.3µg
65.5µg
104%
Vitamin A
1137µg
271µg
96%
Choline
490.9mg
89%
Magnesium
26mg
300mg
65%
Vitamin B5
0.28mg
3.5mg
64%
Sodium
65mg
1500mg
62%
Vitamin B2
0.051mg
0.62mg
44%
Polyunsaturated fat
1.214g
7.405g
41%
Vitamin B3
4.487mg
0.12mg
27%
Calcium
26mg
275mg
25%
Vitamin B6
0.077mg
0.32mg
19%
Vitamin D*
117 IU
15%
Vitamin D
2.9µg
15%
Vitamin E
1.89mg
13%
Phosphorus
277mg
356mg
11%
Monounsaturated fat
9.218g
4.631g
11%
Zinc
2.08mg
0.95mg
10%
Copper
0.029mg
0.11mg
9%
Folate
17µg
50µg
8%
Fats
14.95g
17.9g
5%
Potassium
349mg
181mg
5%
Saturated fat
3.023g
4.06g
5%
Protein
23.65g
24.6g
2%
Vitamin C
1.8mg
0mg
2%
Calories
236kcal
264kcal
1%
Carbs
0g
4g
1%
Vitamin B1
0.183mg
0.19mg
1%
Vitamin K
0.6µg
1%
Protein per 100 calories
10g
9.3g
N/A
Calories per 10 g protein
100kcal
107kcal
N/A
Weight per 100 calories
42g
38g
N/A
Unsaturated / Saturated Fat ratio
3.5
3
N/A
Net carbs
0g
4g
N/A
Manganese
0.04mg
0.05mg
0%
Tryptophan
0.265mg
0.323mg
0%
Threonine
1.037mg
1.263mg
0%
Isoleucine
1.09mg
1.035mg
0%
Leucine
1.922mg
2.133mg
0%
Lysine
2.171mg
1.834mg
0%
Methionine
0.7mg
0.646mg
0%
Phenylalanine
0.923mg
1.071mg
0%
Valine
1.218mg
1.263mg
0%
Histidine
0.696mg
0.649mg
0%
Omega-3 - EPA
0.108g
2.741g
N/A
Omega-3 - DHA
0.081g
3.8g
N/A
Omega-3 - DPA
0.095g
0.229g
N/A
Macronutrient Comparison
Macronutrient breakdown side-by-side comparison
1
24%
15%
59%
2%
Protein:
23.65 g
Fats:
14.95 g
Carbs:
0 g
Water:
59.31 g
Other:
2.09 g
4
25%
18%
4%
48%
6%
Protein:
24.6 g
Fats:
17.9 g
Carbs:
4 g
Water:
47.5 g
Other:
6 g
Contains
more
Water Water
+24.9%
Contains
more
Fats Fats
+19.7%
Contains
more
Carbs Carbs
+∞%
Contains
more
Other Other
+187.1%
Fat Type Comparison
Fat type breakdown side-by-side comparison
2
22%
69%
9%
Saturated fat:
Sat. Fat
3.023 g
Monounsaturated fat:
Mono. Fat
9.218 g
Polyunsaturated fat:
Poly. Fat
1.214 g
1
25%
29%
46%
Saturated fat:
Sat. Fat
4.06 g
Monounsaturated fat:
Mono. Fat
4.631 g
Polyunsaturated fat:
Poly. Fat
7.405 g
Contains
less
Sat. Fat Saturated fat
-25.5%
Contains
more
Mono. Fat Monounsaturated fat
+99%
Contains
more
Poly. Fat Polyunsaturated fat
+510%