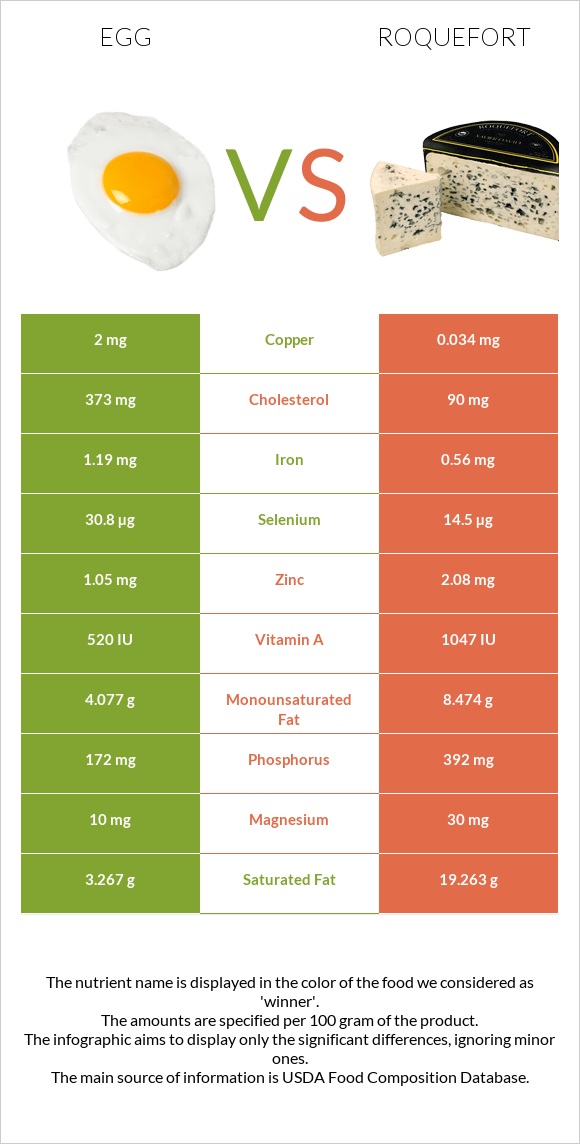
How are eggs and roquefort different? Eggs have more copper, selenium, and vitamin B12; however, roquefort is richer in calcium, phosphorus, vitamin A, and zinc. Eggs cover your daily need for copper, 218% more than roquefort. Eggs have 4 times more cholesterol than roquefort. Eggs have 373mg of cholesterol, while roquefort has 90mg. Roquefort has a higher glycemic index. The glycemic index of roquefort is 27, while the glycemic index of eggs is 0. Egg, whole, cooked, hard-boiled and Cheese, roquefort types were used in this article.
Infographic
Mineral Comparison
Mineral comparison score is based on the number of minerals by which one or the other food is richer. The "coverage" charts below show how much of the daily needs can be covered by 300 grams of the food.
5
100 g
300 g
1 tbsp - 8.5g 1 large - 50g 1 cup, chopped - 136g
Magnesium
Magnesium
Calcium
Calcium
Potassium
Potassium
Iron
Iron
Copper
Copper
Zinc
Zinc
Phosphorus
Phosphorus
Sodium
Sodium
Manganese
Manganese
Selenium
Selenium
7.1%
15%
11%
45%
667%
29%
74%
16%
3.4%
168%
5
100 g
300 g
1 oz - 28.35g 1 package (3 oz) - 85g
Magnesium
Magnesium
Calcium
Calcium
Potassium
Potassium
Iron
Iron
Copper
Copper
Zinc
Zinc
Phosphorus
Phosphorus
Sodium
Sodium
Manganese
Manganese
Selenium
Selenium
21%
199%
8%
21%
11%
57%
168%
236%
3.9%
79%
Vitamin Comparison
Vitamin comparison score is based on the number of vitamins by which one or the other food is richer. The "coverage" charts below show how much of the daily needs can be covered by 300 grams of the food.
5
100 g
300 g
1 tbsp - 8.5g 1 large - 50g 1 cup, chopped - 136g
Vitamin C
Vit. C
Vitamin D
Vit. D
Vitamin A
Vit. A
Vitamin E
Vit. E
Vitamin B1
Vit. B1
Vitamin B2
Vit. B2
Vitamin B3
Vit. B3
Vitamin B5
Vit. B5
Vitamin B6
Vit. B6
Vitamin B12
Vit. B12
Vitamin K
Vit. K
Folate
Folate
0%
33%
50%
21%
17%
118%
1.2%
84%
28%
139%
0.75%
33%
5
100 g
300 g
1 oz - 28.35g 1 package (3 oz) - 85g
Vitamin C
Vit. C
Vitamin D
Vit. D
Vitamin A
Vit. A
Vitamin E
Vit. E
Vitamin B1
Vit. B1
Vitamin B2
Vit. B2
Vitamin B3
Vit. B3
Vitamin B5
Vit. B5
Vitamin B6
Vit. B6
Vitamin B12
Vit. B12
Vitamin K
Vit. K
Folate
Folate
0%
0%
98%
0%
10%
135%
14%
104%
29%
80%
0%
37%
All nutrients comparison - raw data values
Nutrient
DV% diff.
Copper
2mg
0.034mg
218%
Cholesterol
373mg
90mg
94%
Sodium
124mg
1809mg
73%
Saturated fat
3.267g
19.263g
73%
Calcium
50mg
662mg
61%
Choline
293.8mg
53%
Fats
10.61g
30.64g
31%
Phosphorus
172mg
392mg
31%
Selenium
30.8µg
14.5µg
30%
Vitamin B12
1.11µg
0.64µg
20%
Protein
12.58g
21.54g
18%
Vitamin A
149µg
294µg
16%
Calories
155kcal
369kcal
11%
Vitamin D*
87 IU
11%
Vitamin D
2.2µg
11%
Monounsaturated fat
4.077g
8.474g
11%
Zinc
1.05mg
2.08mg
9%
Iron
1.19mg
0.56mg
8%
Vitamin E
1.03mg
7%
Vitamin B5
1.398mg
1.731mg
7%
Vitamin B2
0.513mg
0.586mg
6%
Magnesium
10mg
30mg
5%
Vitamin B3
0.064mg
0.734mg
4%
Vitamin B1
0.066mg
0.04mg
2%
Potassium
126mg
91mg
1%
Folate
44µg
49µg
1%
Polyunsaturated fat
1.414g
1.32g
1%
Protein per 100 calories
8.1g
5.8g
N/A
Calories per 10 g protein
123kcal
171kcal
N/A
Weight per 100 calories
65g
27g
N/A
Unsaturated / Saturated Fat ratio
1.7
0.51
N/A
Net carbs
1.12g
2g
N/A
Carbs
1.12g
2g
0%
Sugar
1.12g
N/A
Manganese
0.026mg
0.03mg
0%
Vitamin B6
0.121mg
0.124mg
0%
Vitamin K
0.3µg
0%
Tryptophan
0.153mg
0.303mg
0%
Threonine
0.604mg
0.965mg
0%
Isoleucine
0.686mg
1.217mg
0%
Leucine
1.075mg
2.114mg
0%
Lysine
0.904mg
1.848mg
0%
Methionine
0.392mg
0.558mg
0%
Phenylalanine
0.668mg
1.023mg
0%
Valine
0.767mg
1.614mg
0%
Histidine
0.298mg
0.602mg
0%
Omega-3 - EPA
0.005g
N/A
Omega-3 - DHA
0.038g
N/A
Macronutrient Comparison
Macronutrient breakdown side-by-side comparison
1
13%
11%
75%
Protein:
12.58 g
Fats:
10.61 g
Carbs:
1.12 g
Water:
74.62 g
Other:
1.07 g
4
22%
31%
2%
39%
6%
Protein:
21.54 g
Fats:
30.64 g
Carbs:
2 g
Water:
39.38 g
Other:
6.44 g
Contains
more
Water Water
+89.5%
Contains
more
Protein Protein
+71.2%
Contains
more
Fats Fats
+188.8%
Contains
more
Carbs Carbs
+78.6%
Contains
more
Other Other
+501.9%
Fat Type Comparison
Fat type breakdown side-by-side comparison
2
37%
47%
16%
Saturated fat:
Sat. Fat
3.267 g
Monounsaturated fat:
Mono. Fat
4.077 g
Polyunsaturated fat:
Poly. Fat
1.414 g
1
66%
29%
5%
Saturated fat:
Sat. Fat
19.263 g
Monounsaturated fat:
Mono. Fat
8.474 g
Polyunsaturated fat:
Poly. Fat
1.32 g
Contains
less
Sat. Fat Saturated fat
-83%
Contains
more
Mono. Fat Monounsaturated fat
+107.8%
~equal in
Polyunsaturated fat
~1.32g