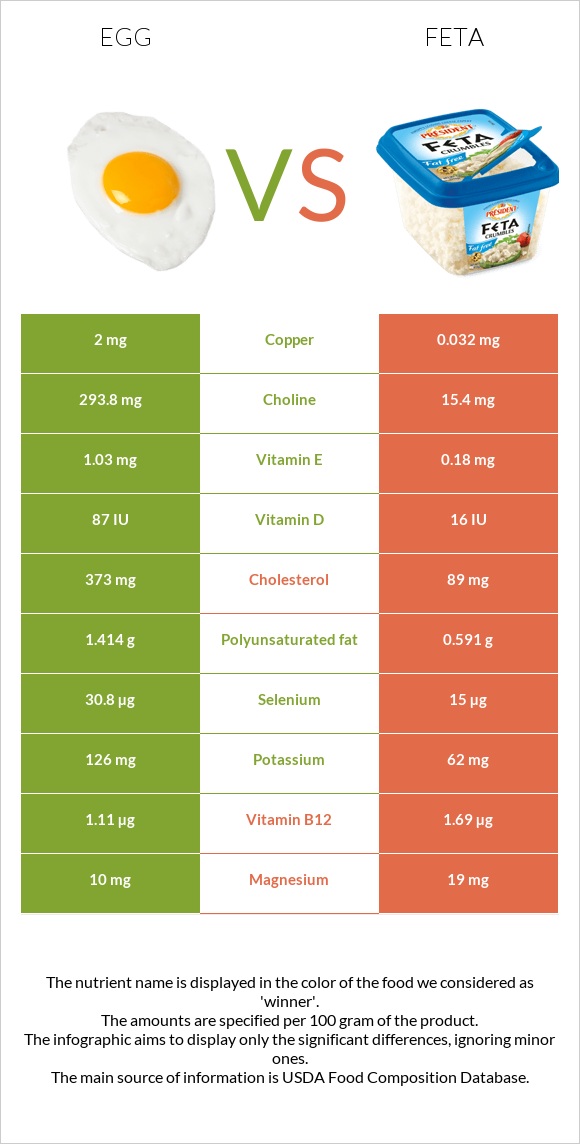
How are eggs and feta different? Eggs have more copper, choline, and selenium; however, feta is richer in calcium, vitamin B2, vitamin B12, and phosphorus. Eggs cover your daily need for copper, 219% more than feta. Eggs have 19 times more choline than feta. Eggs have 293.8mg of choline, while feta has 15.4mg. Feta contains less cholesterol. Feta has a higher glycemic index. The glycemic index of feta is 27, while the glycemic index of eggs is 0. Egg, whole, cooked, hard-boiled and Cheese, feta types were used in this article.
Infographic
Mineral Comparison
Mineral comparison score is based on the number of minerals by which one or the other food is richer. The "coverage" charts below show how much of the daily needs can be covered by 300 grams of the food.
5
100 g
300 g
1 tbsp - 8.5g 1 large - 50g 1 cup, chopped - 136g
Magnesium
Magnesium
Calcium
Calcium
Potassium
Potassium
Iron
Iron
Copper
Copper
Zinc
Zinc
Phosphorus
Phosphorus
Sodium
Sodium
Manganese
Manganese
Selenium
Selenium
7.1%
15%
11%
45%
667%
29%
74%
16%
3.4%
168%
4
100 g
300 g
1 cubic inch - 17g 1 oz - 28.35g 1 wedge (1.33 oz) - 38g 1 cup, crumbled - 150g
Magnesium
Magnesium
Calcium
Calcium
Potassium
Potassium
Iron
Iron
Copper
Copper
Zinc
Zinc
Phosphorus
Phosphorus
Sodium
Sodium
Manganese
Manganese
Selenium
Selenium
14%
148%
5.5%
24%
11%
79%
144%
120%
3.7%
82%
Vitamin Comparison
Vitamin comparison score is based on the number of vitamins by which one or the other food is richer. The "coverage" charts below show how much of the daily needs can be covered by 300 grams of the food.
5
100 g
300 g
1 tbsp - 8.5g 1 large - 50g 1 cup, chopped - 136g
Vitamin C
Vit. C
Vitamin D
Vit. D
Vitamin A
Vit. A
Vitamin E
Vit. E
Vitamin B1
Vit. B1
Vitamin B2
Vit. B2
Vitamin B3
Vit. B3
Vitamin B5
Vit. B5
Vitamin B6
Vit. B6
Vitamin B12
Vit. B12
Vitamin K
Vit. K
Folate
Folate
0%
33%
50%
21%
17%
118%
1.2%
84%
28%
139%
0.75%
33%
6
100 g
300 g
1 cubic inch - 17g 1 oz - 28.35g 1 wedge (1.33 oz) - 38g 1 cup, crumbled - 150g
Vitamin C
Vit. C
Vitamin D
Vit. D
Vitamin A
Vit. A
Vitamin E
Vit. E
Vitamin B1
Vit. B1
Vitamin B2
Vit. B2
Vitamin B3
Vit. B3
Vitamin B5
Vit. B5
Vitamin B6
Vit. B6
Vitamin B12
Vit. B12
Vitamin K
Vit. K
Folate
Folate
0%
6%
42%
3.6%
39%
195%
19%
58%
98%
211%
4.5%
24%
All nutrients comparison - raw data values
Nutrient
DV% diff.
Copper
2mg
0.032mg
219%
Cholesterol
373mg
89mg
95%
Saturated fat
3.267g
14.946g
53%
Choline
293.8mg
15.4mg
51%
Calcium
50mg
493mg
44%
Sodium
124mg
917mg
34%
Selenium
30.8µg
15µg
29%
Vitamin B2
0.513mg
0.844mg
25%
Phosphorus
172mg
337mg
24%
Vitamin B12
1.11µg
1.69µg
24%
Vitamin B6
0.121mg
0.424mg
23%
Zinc
1.05mg
2.88mg
17%
Fats
10.61g
21.28g
16%
Vitamin D*
87 IU
16 IU
9%
Vitamin D
2.2µg
0.4µg
9%
Vitamin B5
1.398mg
0.967mg
9%
Iron
1.19mg
0.65mg
7%
Vitamin B1
0.066mg
0.154mg
7%
Vitamin E
1.03mg
0.18mg
6%
Vitamin B3
0.064mg
0.991mg
6%
Calories
155kcal
264kcal
5%
Polyunsaturated fat
1.414g
0.591g
5%
Protein
12.58g
14.21g
3%
Vitamin A
149µg
125µg
3%
Folate
44µg
32µg
3%
Magnesium
10mg
19mg
2%
Potassium
126mg
62mg
2%
Carbs
1.12g
4.09g
1%
Vitamin K
0.3µg
1.8µg
1%
Monounsaturated fat
4.077g
4.623g
1%
Protein per 100 calories
8.1g
5.4g
N/A
Calories per 10 g protein
123kcal
186kcal
N/A
Weight per 100 calories
65g
38g
N/A
Unsaturated / Saturated Fat ratio
1.7
0.35
N/A
Net carbs
1.12g
4.09g
N/A
Sugar
1.12g
4.09g
N/A
Manganese
0.026mg
0.028mg
0%
Tryptophan
0.153mg
0.2mg
0%
Threonine
0.604mg
0.637mg
0%
Isoleucine
0.686mg
0.803mg
0%
Leucine
1.075mg
1.395mg
0%
Lysine
0.904mg
1.219mg
0%
Methionine
0.392mg
0.368mg
0%
Phenylalanine
0.668mg
0.675mg
0%
Valine
0.767mg
1.065mg
0%
Histidine
0.298mg
0.397mg
0%
Omega-3 - EPA
0.005g
0g
N/A
Omega-3 - DHA
0.038g
0g
N/A
Macronutrient Comparison
Macronutrient breakdown side-by-side comparison
1
13%
11%
75%
Protein:
12.58 g
Fats:
10.61 g
Carbs:
1.12 g
Water:
74.62 g
Other:
1.07 g
4
14%
21%
4%
55%
5%
Protein:
14.21 g
Fats:
21.28 g
Carbs:
4.09 g
Water:
55.22 g
Other:
5.2 g
Contains
more
Water Water
+35.1%
Contains
more
Protein Protein
+13%
Contains
more
Fats Fats
+100.6%
Contains
more
Carbs Carbs
+265.2%
Contains
more
Other Other
+386%
Fat Type Comparison
Fat type breakdown side-by-side comparison
2
37%
47%
16%
Saturated fat:
Sat. Fat
3.267 g
Monounsaturated fat:
Mono. Fat
4.077 g
Polyunsaturated fat:
Poly. Fat
1.414 g
1
74%
23%
3%
Saturated fat:
Sat. Fat
14.946 g
Monounsaturated fat:
Mono. Fat
4.623 g
Polyunsaturated fat:
Poly. Fat
0.591 g
Contains
less
Sat. Fat Saturated fat
-78.1%
Contains
more
Poly. Fat Polyunsaturated fat
+139.3%
Contains
more
Mono. Fat Monounsaturated fat
+13.4%