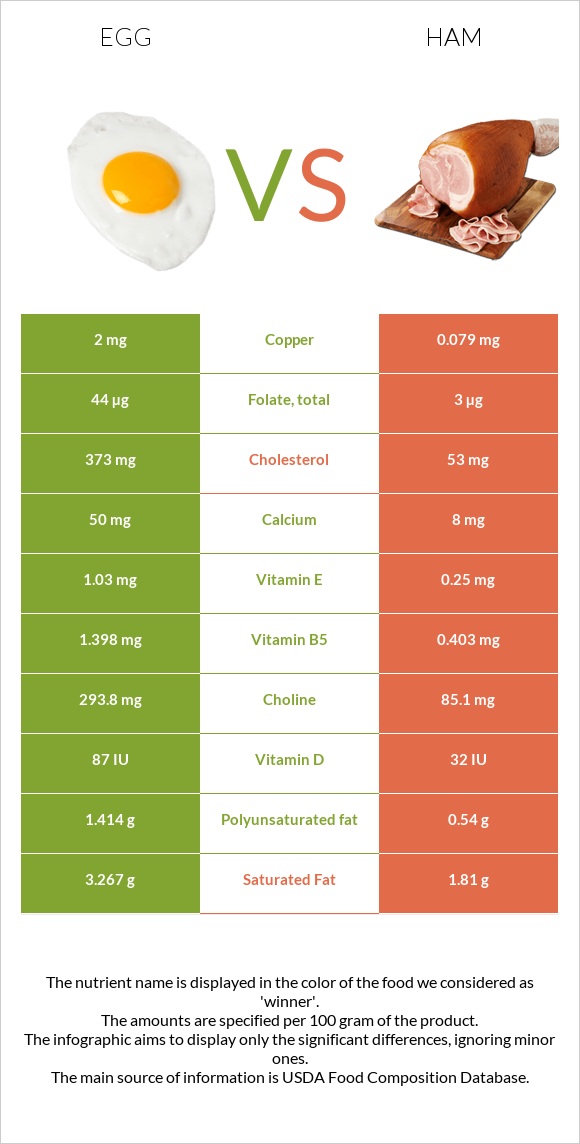
Summary of differences between eggs and ham Eggs have more copper, choline, vitamin B2, selenium, and vitamin B5; however, ham is higher in vitamin B1, vitamin B3, and vitamin B6. Eggs cover your daily need for copper, 213% more than ham. Eggs have 7 times more cholesterol than ham. While eggs have 373mg of cholesterol, ham has only 53mg. These are the specific foods used in this comparison Egg, whole, cooked, hard-boiled and Pork, cured, ham, boneless, extra lean (approximately 5% fat), roasted .
Infographic
Mineral Comparison
Mineral comparison score is based on the number of minerals by which one or the other food is richer. The "coverage" charts below show how much of the daily needs can be covered by 300 grams of the food.
4
100 g
300 g
1 tbsp - 8.5g 1 large - 50g 1 cup, chopped - 136g
Magnesium
Magnesium
Calcium
Calcium
Potassium
Potassium
Iron
Iron
Copper
Copper
Zinc
Zinc
Phosphorus
Phosphorus
Sodium
Sodium
Manganese
Manganese
Selenium
Selenium
7.1%
15%
11%
45%
667%
29%
74%
16%
3.4%
168%
6
100 g
300 g
3 oz - 85g 1 cup - 140g
Magnesium
Magnesium
Calcium
Calcium
Potassium
Potassium
Iron
Iron
Copper
Copper
Zinc
Zinc
Phosphorus
Phosphorus
Sodium
Sodium
Manganese
Manganese
Selenium
Selenium
10%
2.4%
25%
56%
26%
79%
84%
157%
7%
106%
Vitamin Comparison
Vitamin comparison score is based on the number of vitamins by which one or the other food is richer. The "coverage" charts below show how much of the daily needs can be covered by 300 grams of the food.
8
100 g
300 g
1 tbsp - 8.5g 1 large - 50g 1 cup, chopped - 136g
Vitamin C
Vit. C
Vitamin D
Vit. D
Vitamin A
Vit. A
Vitamin E
Vit. E
Vitamin B1
Vit. B1
Vitamin B2
Vit. B2
Vitamin B3
Vit. B3
Vitamin B5
Vit. B5
Vitamin B6
Vit. B6
Vitamin B12
Vit. B12
Vitamin K
Vit. K
Folate
Folate
0%
33%
50%
21%
17%
118%
1.2%
84%
28%
139%
0.75%
33%
3
100 g
300 g
3 oz - 85g 1 cup - 140g
Vitamin C
Vit. C
Vitamin D
Vit. D
Vitamin A
Vit. A
Vitamin E
Vit. E
Vitamin B1
Vit. B1
Vitamin B2
Vit. B2
Vitamin B3
Vit. B3
Vitamin B5
Vit. B5
Vitamin B6
Vit. B6
Vitamin B12
Vit. B12
Vitamin K
Vit. K
Folate
Folate
0%
12%
0%
5%
189%
47%
75%
24%
92%
81%
0%
2.3%
All nutrients comparison - raw data values
Nutrient
DV% diff.
Copper
2mg
0.079mg
213%
Cholesterol
373mg
53mg
107%
Vitamin B1
0.066mg
0.754mg
57%
Sodium
124mg
1203mg
47%
Choline
293.8mg
85.1mg
38%
Vitamin B3
0.064mg
4.023mg
25%
Vitamin B2
0.513mg
0.202mg
24%
Selenium
30.8µg
19.5µg
21%
Vitamin B6
0.121mg
0.4mg
21%
Vitamin B5
1.398mg
0.403mg
20%
Vitamin B12
1.11µg
0.65µg
19%
Protein
12.58g
20.93g
17%
Zinc
1.05mg
2.88mg
17%
Vitamin A
149µg
0µg
17%
Folate
44µg
3µg
10%
Fats
10.61g
5.53g
8%
Vitamin D*
87 IU
32 IU
7%
Vitamin D
2.2µg
0.8µg
7%
Saturated fat
3.267g
1.81g
7%
Polyunsaturated fat
1.414g
0.54g
6%
Potassium
126mg
287mg
5%
Vitamin E
1.03mg
0.25mg
5%
Calcium
50mg
8mg
4%
Iron
1.19mg
1.48mg
4%
Monounsaturated fat
4.077g
2.62g
4%
Phosphorus
172mg
196mg
3%
Calories
155kcal
145kcal
1%
Magnesium
10mg
14mg
1%
Manganese
0.026mg
0.054mg
1%
Protein per 100 calories
8.1g
14g
N/A
Calories per 10 g protein
123kcal
69kcal
N/A
Weight per 100 calories
65g
69g
N/A
Unsaturated / Saturated Fat ratio
1.7
1.7
N/A
Net carbs
1.12g
1.5g
N/A
Carbs
1.12g
1.5g
0%
Sugar
1.12g
0g
N/A
Vitamin K
0.3µg
0µg
0%
Tryptophan
0.153mg
0.251mg
0%
Threonine
0.604mg
0.931mg
0%
Isoleucine
0.686mg
0.918mg
0%
Leucine
1.075mg
1.661mg
0%
Lysine
0.904mg
1.775mg
0%
Methionine
0.392mg
0.553mg
0%
Phenylalanine
0.668mg
0.904mg
0%
Valine
0.767mg
0.908mg
0%
Histidine
0.298mg
0.75mg
0%
Omega-3 - EPA
0.005g
0g
N/A
Omega-3 - DHA
0.038g
0g
N/A
Macronutrient Comparison
Macronutrient breakdown side-by-side comparison
2
13%
11%
75%
Protein:
12.58 g
Fats:
10.61 g
Carbs:
1.12 g
Water:
74.62 g
Other:
1.07 g
3
21%
6%
68%
4%
Protein:
20.93 g
Fats:
5.53 g
Carbs:
1.5 g
Water:
67.67 g
Other:
4.37 g
Contains
more
Fats Fats
+91.9%
Contains
more
Protein Protein
+66.4%
Contains
more
Carbs Carbs
+33.9%
Contains
more
Other Other
+308.4%
Fat Type Comparison
Fat type breakdown side-by-side comparison
2
37%
47%
16%
Saturated fat:
Sat. Fat
3.267 g
Monounsaturated fat:
Mono. Fat
4.077 g
Polyunsaturated fat:
Poly. Fat
1.414 g
1
36%
53%
11%
Saturated fat:
Sat. Fat
1.81 g
Monounsaturated fat:
Mono. Fat
2.62 g
Polyunsaturated fat:
Poly. Fat
0.54 g
Contains
more
Mono. Fat Monounsaturated fat
+55.6%
Contains
more
Poly. Fat Polyunsaturated fat
+161.9%
Contains
less
Sat. Fat Saturated fat
-44.6%