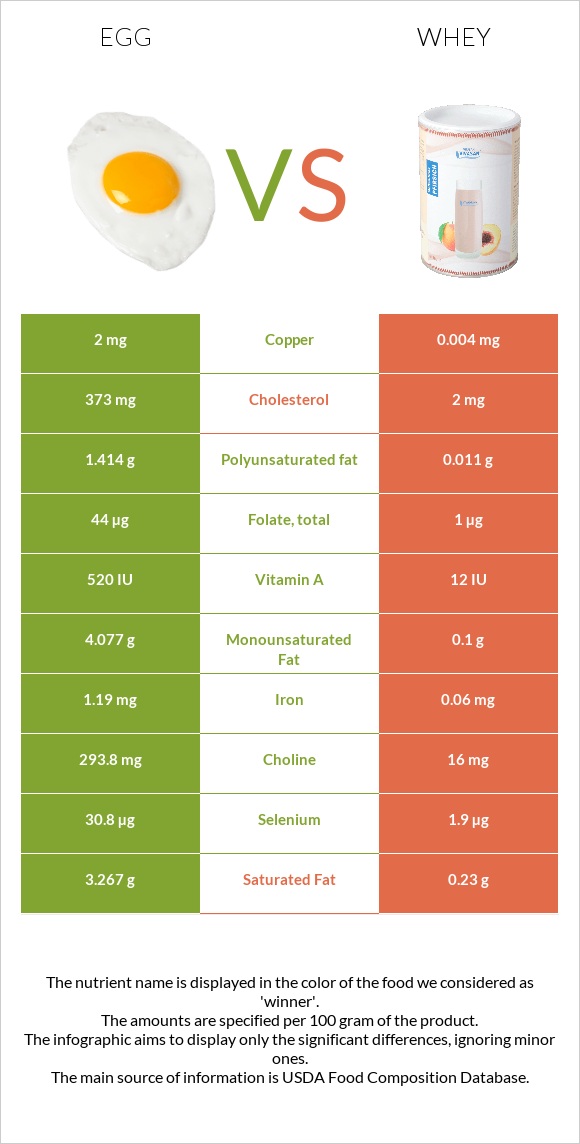
Summary of differences between eggs and whey Whey has less copper, selenium, choline, vitamin B12, vitamin B2, vitamin B5, phosphorus, and iron than eggs. Eggs cover your daily need for copper, 222% more than whey. Eggs have 187 times more cholesterol than whey. While eggs have 373mg of cholesterol, whey has only 2mg. The glycemic index of whey is higher. These are the specific foods used in this comparison Egg, whole, cooked, hard-boiled and Whey, sweet, fluid .
Infographic
Mineral Comparison
Mineral comparison score is based on the number of minerals by which one or the other food is richer. The "coverage" charts below show how much of the daily needs can be covered by 300 grams of the food.
7
100 g
300 g
1 tbsp - 8.5g 1 large - 50g 1 cup, chopped - 136g
Magnesium
Magnesium
Calcium
Calcium
Potassium
Potassium
Iron
Iron
Copper
Copper
Zinc
Zinc
Phosphorus
Phosphorus
Sodium
Sodium
Manganese
Manganese
Selenium
Selenium
7.1%
15%
11%
45%
667%
29%
74%
16%
3.4%
168%
2
100 g
300 g
1 cup - 246g 1 quart - 984g
Magnesium
Magnesium
Calcium
Calcium
Potassium
Potassium
Iron
Iron
Copper
Copper
Zinc
Zinc
Phosphorus
Phosphorus
Sodium
Sodium
Manganese
Manganese
Selenium
Selenium
5.7%
14%
14%
2.3%
1.3%
3.5%
20%
7%
0.13%
10%
Vitamin Comparison
Vitamin comparison score is based on the number of vitamins by which one or the other food is richer. The "coverage" charts below show how much of the daily needs can be covered by 300 grams of the food.
10
100 g
300 g
1 tbsp - 8.5g 1 large - 50g 1 cup, chopped - 136g
Vitamin C
Vit. C
Vitamin D
Vit. D
Vitamin A
Vit. A
Vitamin E
Vit. E
Vitamin B1
Vit. B1
Vitamin B2
Vit. B2
Vitamin B3
Vit. B3
Vitamin B5
Vit. B5
Vitamin B6
Vit. B6
Vitamin B12
Vit. B12
Vitamin K
Vit. K
Folate
Folate
0%
33%
50%
21%
17%
118%
1.2%
84%
28%
139%
0.75%
33%
2
100 g
300 g
1 cup - 246g 1 quart - 984g
Vitamin C
Vit. C
Vitamin D
Vit. D
Vitamin A
Vit. A
Vitamin E
Vit. E
Vitamin B1
Vit. B1
Vitamin B2
Vit. B2
Vitamin B3
Vit. B3
Vitamin B5
Vit. B5
Vitamin B6
Vit. B6
Vitamin B12
Vit. B12
Vitamin K
Vit. K
Folate
Folate
0.33%
0%
1%
0%
9%
36%
1.4%
23%
7.2%
35%
0%
0.75%
All nutrients comparison - raw data values
Nutrient
DV% diff.
Copper
2mg
0.004mg
222%
Cholesterol
373mg
2mg
124%
Selenium
30.8µg
1.9µg
53%
Choline
293.8mg
16mg
51%
Vitamin B12
1.11µg
0.28µg
35%
Vitamin B2
0.513mg
0.158mg
27%
Protein
12.58g
0.85g
23%
Vitamin B5
1.398mg
0.383mg
20%
Phosphorus
172mg
46mg
18%
Fats
10.61g
0.36g
16%
Vitamin A
149µg
3µg
16%
Iron
1.19mg
0.06mg
14%
Saturated fat
3.267g
0.23g
14%
Vitamin D*
87 IU
11%
Vitamin D
2.2µg
11%
Folate
44µg
1µg
11%
Monounsaturated fat
4.077g
0.1g
10%
Polyunsaturated fat
1.414g
0.011g
9%
Zinc
1.05mg
0.13mg
8%
Vitamin E
1.03mg
0mg
7%
Vitamin B6
0.121mg
0.031mg
7%
Calories
155kcal
27kcal
6%
Sodium
124mg
54mg
3%
Vitamin B1
0.066mg
0.036mg
3%
Carbs
1.12g
5.14g
1%
Potassium
126mg
161mg
1%
Manganese
0.026mg
0.001mg
1%
Protein per 100 calories
8.1g
3.1g
N/A
Calories per 10 g protein
123kcal
318kcal
N/A
Weight per 100 calories
65g
370g
N/A
Unsaturated / Saturated Fat ratio
1.7
0.48
N/A
Vitamin C
0mg
0.1mg
0%
Net carbs
1.12g
5.14g
N/A
Magnesium
10mg
8mg
0%
Calcium
50mg
47mg
0%
Sugar
1.12g
5.14g
N/A
Vitamin B3
0.064mg
0.074mg
0%
Vitamin K
0.3µg
0µg
0%
Tryptophan
0.153mg
0.013mg
0%
Threonine
0.604mg
0.054mg
0%
Isoleucine
0.686mg
0.047mg
0%
Leucine
1.075mg
0.078mg
0%
Lysine
0.904mg
0.068mg
0%
Methionine
0.392mg
0.016mg
0%
Phenylalanine
0.668mg
0.027mg
0%
Valine
0.767mg
0.046mg
0%
Histidine
0.298mg
0.016mg
0%
Omega-3 - EPA
0.005g
0g
N/A
Omega-3 - DHA
0.038g
0g
N/A
Macronutrient Comparison
Macronutrient breakdown side-by-side comparison
3
13%
11%
75%
Protein:
12.58 g
Fats:
10.61 g
Carbs:
1.12 g
Water:
74.62 g
Other:
1.07 g
2
5%
93%
Protein:
0.85 g
Fats:
0.36 g
Carbs:
5.14 g
Water:
93.12 g
Other:
0.53 g
Contains
more
Protein Protein
+1380%
Contains
more
Fats Fats
+2847.2%
Contains
more
Other Other
+101.9%
Contains
more
Carbs Carbs
+358.9%
Contains
more
Water Water
+24.8%
Fat Type Comparison
Fat type breakdown side-by-side comparison
2
37%
47%
16%
Saturated fat:
Sat. Fat
3.267 g
Monounsaturated fat:
Mono. Fat
4.077 g
Polyunsaturated fat:
Poly. Fat
1.414 g
1
67%
29%
3%
Saturated fat:
Sat. Fat
0.23 g
Monounsaturated fat:
Mono. Fat
0.1 g
Polyunsaturated fat:
Poly. Fat
0.011 g
Contains
more
Mono. Fat Monounsaturated fat
+3977%
Contains
more
Poly. Fat Polyunsaturated fat
+12754.5%
Contains
less
Sat. Fat Saturated fat
-93%