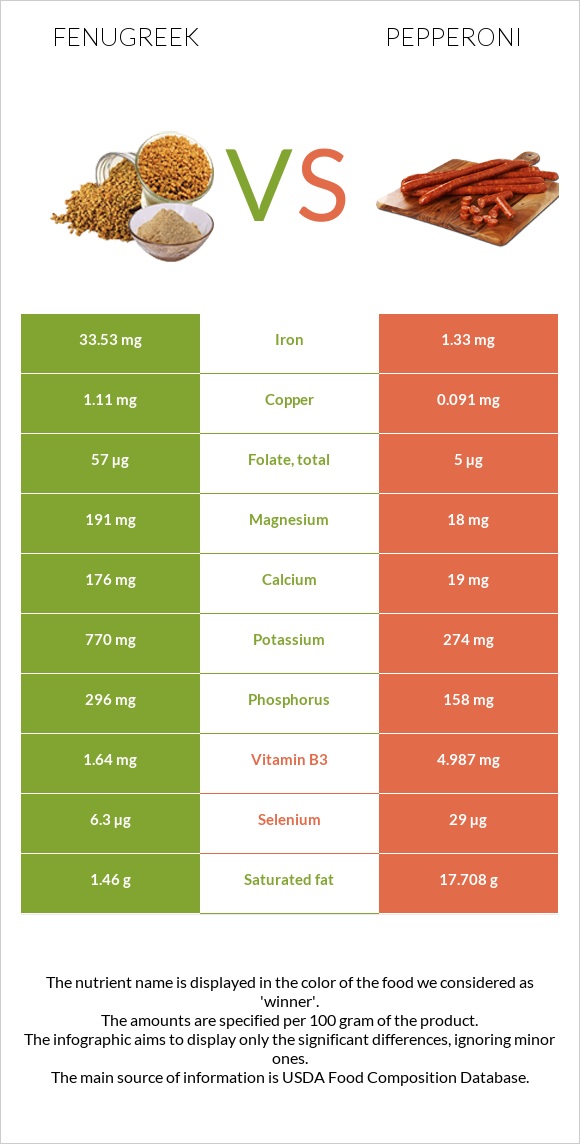
What are the main differences between fenugreek and pepperoni? Fenugreek is richer in iron, copper, fiber, and magnesium, while pepperoni is higher in vitamin B12, selenium, and vitamin B3. Fenugreek's daily need coverage for iron is 403% higher. Fenugreek is lower in saturated fat. Pepperoni has a higher glycemic index (28) than fenugreek (0). We used Spices, fenugreek seed and Pepperoni, beef, and pork, sliced types in this comparison.
Infographic
Mineral Comparison
Mineral comparison score is based on the number of minerals by which one or the other food is richer. The "coverage" charts below show how much of the daily needs can be covered by 300 grams of the food.
8
100 g
300 g
0.25 tsp - 0.5g 1 tbsp - 11.1g
Magnesium
Magnesium
Calcium
Calcium
Potassium
Potassium
Iron
Iron
Copper
Copper
Zinc
Zinc
Phosphorus
Phosphorus
Sodium
Sodium
Manganese
Manganese
Selenium
Selenium
136%
53%
68%
1257%
370%
68%
127%
8.7%
160%
34%
1
100 g
300 g
1 piece - 2g 1 oz - 28g 3 oz - 85g
Magnesium
Magnesium
Calcium
Calcium
Potassium
Potassium
Iron
Iron
Copper
Copper
Zinc
Zinc
Phosphorus
Phosphorus
Sodium
Sodium
Manganese
Manganese
Selenium
Selenium
13%
5.7%
24%
50%
30%
67%
68%
206%
140%
158%
Vitamin Comparison
Vitamin comparison score is based on the number of vitamins by which one or the other food is richer. The "coverage" charts below show how much of the daily needs can be covered by 300 grams of the food.
6
100 g
300 g
0.25 tsp - 0.5g 1 tbsp - 11.1g
Vitamin C
Vit. C
Vitamin D
Vit. D
Vitamin A
Vit. A
Vitamin E
Vit. E
Vitamin B1
Vit. B1
Vitamin B2
Vit. B2
Vitamin B3
Vit. B3
Vitamin B5
Vit. B5
Vitamin B6
Vit. B6
Vitamin B12
Vit. B12
Vitamin K
Vit. K
Folate
Folate
10%
0%
1%
0%
81%
84%
31%
0%
138%
0%
0%
43%
6
100 g
300 g
1 piece - 2g 1 oz - 28g 3 oz - 85g
Vitamin C
Vit. C
Vitamin D
Vit. D
Vitamin A
Vit. A
Vitamin E
Vit. E
Vitamin B1
Vit. B1
Vitamin B2
Vit. B2
Vitamin B3
Vit. B3
Vitamin B5
Vit. B5
Vitamin B6
Vit. B6
Vitamin B12
Vit. B12
Vitamin K
Vit. K
Folate
Folate
0%
20%
0%
21%
68%
59%
94%
56%
84%
163%
15%
3.8%
All nutrients comparison - raw data values
Nutrient
DV% diff.
Iron
33.53mg
1.33mg
403%
Copper
1.11mg
0.091mg
113%
Fiber
24.6g
0g
98%
Saturated fat
1.46g
17.708g
74%
Sodium
67mg
1582mg
66%
Fats
6.41g
46.28g
61%
Vitamin B12
0µg
1.3µg
54%
Monounsaturated fat
20.77g
52%
Magnesium
191mg
18mg
41%
Selenium
6.3µg
29µg
41%
Cholesterol
0mg
97mg
32%
Polyunsaturated fat
4.458g
30%
Vitamin B3
1.64mg
4.987mg
21%
Phosphorus
296mg
158mg
20%
Carbs
58.35g
1.18g
19%
Vitamin B5
0.93mg
19%
Vitamin B6
0.6mg
0.362mg
18%
Calcium
176mg
19mg
16%
Potassium
770mg
274mg
15%
Folate
57µg
5µg
13%
Calories
323kcal
504kcal
9%
Choline
51.2mg
9%
Protein
23g
19.25g
8%
Vitamin B2
0.366mg
0.257mg
8%
Vitamin D*
0 IU
52 IU
7%
Vitamin D
0µg
1.3µg
7%
Vitamin E
1.03mg
7%
Manganese
1.228mg
1.074mg
7%
Vitamin K
5.8µg
5%
Vitamin B1
0.322mg
0.271mg
4%
Vitamin C
3mg
0mg
3%
Zinc
2.5mg
2.44mg
1%
Protein per 100 calories
7.1g
3.8g
N/A
Calories per 10 g protein
140kcal
262kcal
N/A
Weight per 100 calories
31g
20g
N/A
Unsaturated / Saturated Fat ratio
0
1.4
N/A
Net carbs
33.75g
1.18g
N/A
Vitamin A
3µg
0µg
0%
Trans fat
0g
1.527g
N/A
Tryptophan
0.391mg
0.23mg
0%
Threonine
0.898mg
0.869mg
0%
Isoleucine
1.241mg
0.901mg
0%
Leucine
1.757mg
1.575mg
0%
Lysine
1.684mg
1.652mg
0%
Methionine
0.338mg
0.511mg
0%
Phenylalanine
1.089mg
0.778mg
0%
Valine
1.102mg
0.987mg
0%
Histidine
0.668mg
0.688mg
0%
Omega-3 - EPA
0.004g
N/A
Omega-3 - DHA
0.004g
N/A
Omega-3 - ALA
0.164g
N/A
Omega-3 - DPA
0.02g
N/A
Omega-3 - Eicosatrienoic acid
0.018g
N/A
Omega-6 - Gamma-linoleic acid
0.002g
N/A
Omega-6 - Dihomo-gamma-linoleic acid
0.04g
N/A
Omega-6 - Eicosadienoic acid
0.136g
N/A
Omega-6 - Linoleic acid
3.605g
N/A
Macronutrient Comparison
Macronutrient breakdown side-by-side comparison
2
23%
6%
58%
9%
3%
Protein:
23 g
Fats:
6.41 g
Carbs:
58.35 g
Water:
8.84 g
Other:
3.4 g
3
19%
46%
29%
5%
Protein:
19.25 g
Fats:
46.28 g
Carbs:
1.18 g
Water:
28.55 g
Other:
4.74 g
Contains
more
Protein Protein
+19.5%
Contains
more
Carbs Carbs
+4844.9%
Contains
more
Fats Fats
+622%
Contains
more
Water Water
+223%
Contains
more
Other Other
+39.4%
Fat Type Comparison
Fat type breakdown side-by-side comparison
1
100%
Saturated fat:
Sat. Fat
1.46 g
Monounsaturated fat:
Mono. Fat
0 g
Polyunsaturated fat:
Poly. Fat
0 g
2
41%
48%
10%
Saturated fat:
Sat. Fat
17.708 g
Monounsaturated fat:
Mono. Fat
20.77 g
Polyunsaturated fat:
Poly. Fat
4.458 g
Contains
less
Sat. Fat Saturated fat
-91.8%