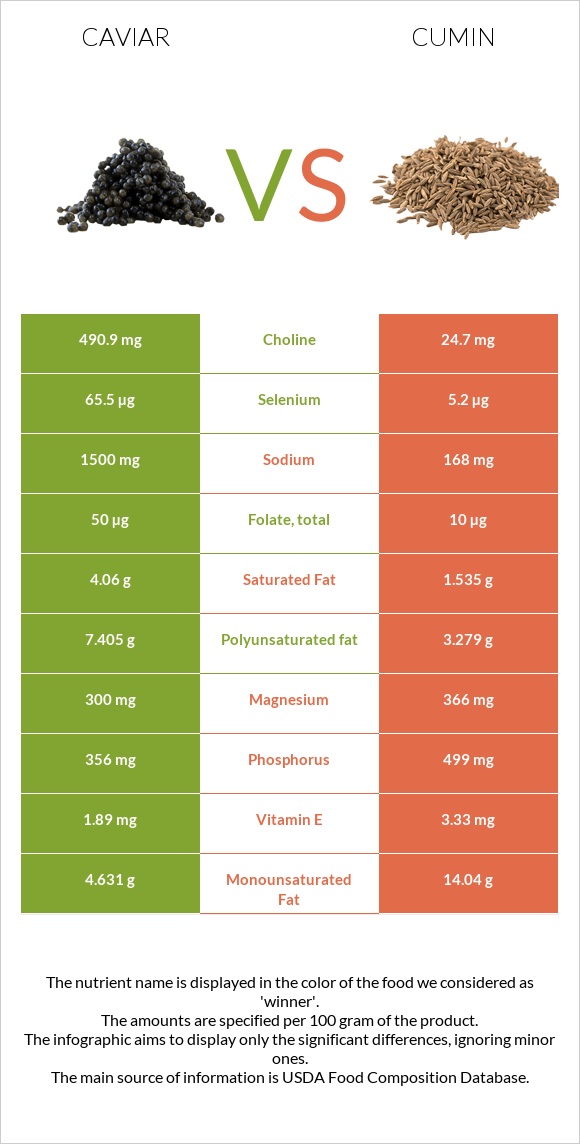
What are the main differences between caviar and cumin? Caviar is richer in vitamin B12, selenium, and choline, yet cumin is richer in iron, manganese, copper, calcium, and potassium. Caviar's daily need coverage for vitamin B12 is 833% higher. We used Fish, caviar, black, and red, granular and Spices, cumin seed types in this comparison.
Infographic
Mineral Comparison
Mineral comparison score is based on the number of minerals by which one or the other food is richer. The "coverage" charts below show how much of the daily needs can be covered by 300 grams of the food.
1
100 g
300 g
1 tbsp - 16g 1 oz - 28.35g
Magnesium
Magnesium
Calcium
Calcium
Potassium
Potassium
Iron
Iron
Copper
Copper
Zinc
Zinc
Phosphorus
Phosphorus
Sodium
Sodium
Manganese
Manganese
Selenium
Selenium
214%
83%
16%
446%
37%
26%
153%
196%
6.5%
357%
9
100 g
300 g
0.25 tsp, whole - 0.5g 1 tbsp, whole - 6g
Magnesium
Magnesium
Calcium
Calcium
Potassium
Potassium
Iron
Iron
Copper
Copper
Zinc
Zinc
Phosphorus
Phosphorus
Sodium
Sodium
Manganese
Manganese
Selenium
Selenium
261%
279%
158%
2489%
289%
131%
214%
22%
435%
28%
Vitamin Comparison
Vitamin comparison score is based on the number of vitamins by which one or the other food is richer. The "coverage" charts below show how much of the daily needs can be covered by 300 grams of the food.
6
100 g
300 g
1 tbsp - 16g 1 oz - 28.35g
Vitamin C
Vit. C
Vitamin D
Vit. D
Vitamin A
Vit. A
Vitamin E
Vit. E
Vitamin B1
Vit. B1
Vitamin B2
Vit. B2
Vitamin B3
Vit. B3
Vitamin B5
Vit. B5
Vitamin B6
Vit. B6
Vitamin B12
Vit. B12
Vitamin K
Vit. K
Folate
Folate
0%
44%
90%
38%
48%
143%
2.3%
210%
74%
2500%
1.5%
38%
6
100 g
300 g
0.25 tsp, whole - 0.5g 1 tbsp, whole - 6g
Vitamin C
Vit. C
Vitamin D
Vit. D
Vitamin A
Vit. A
Vitamin E
Vit. E
Vitamin B1
Vit. B1
Vitamin B2
Vit. B2
Vitamin B3
Vit. B3
Vitamin B5
Vit. B5
Vitamin B6
Vit. B6
Vitamin B12
Vit. B12
Vitamin K
Vit. K
Folate
Folate
26%
0%
21%
67%
157%
75%
86%
0%
100%
0%
14%
7.5%
All nutrients comparison - raw data values
Nutrient
DV% diff.
Vitamin B12
20µg
0µg
833%
Iron
11.88mg
66.36mg
681%
Cholesterol
588mg
0mg
196%
Manganese
0.05mg
3.333mg
143%
Selenium
65.5µg
5.2µg
110%
Choline
490.9mg
24.7mg
85%
Copper
0.11mg
0.867mg
84%
Vitamin B5
3.5mg
70%
Calcium
275mg
931mg
66%
Sodium
1500mg
168mg
58%
Potassium
181mg
1788mg
47%
Fiber
0g
10.5g
42%
Vitamin B1
0.19mg
0.628mg
37%
Zinc
0.95mg
4.8mg
35%
Vitamin B3
0.12mg
4.579mg
28%
Polyunsaturated fat
7.405g
3.279g
28%
Monounsaturated fat
4.631g
14.04g
24%
Vitamin A
271µg
64µg
23%
Vitamin B2
0.62mg
0.327mg
23%
Phosphorus
356mg
499mg
20%
Magnesium
300mg
366mg
16%
Vitamin D*
117 IU
0 IU
15%
Vitamin D
2.9µg
0µg
15%
Protein
24.6g
17.81g
14%
Carbs
4g
44.24g
13%
Saturated fat
4.06g
1.535g
11%
Vitamin E
1.89mg
3.33mg
10%
Folate
50µg
10µg
10%
Vitamin C
0mg
7.7mg
9%
Vitamin B6
0.32mg
0.435mg
9%
Fats
17.9g
22.27g
7%
Calories
264kcal
375kcal
6%
Vitamin K
0.6µg
5.4µg
4%
Protein per 100 calories
9.3g
4.7g
N/A
Calories per 10 g protein
107kcal
211kcal
N/A
Weight per 100 calories
38g
27g
N/A
Unsaturated / Saturated Fat ratio
3
11
N/A
Net carbs
4g
33.74g
N/A
Sugar
0g
2.25g
N/A
Tryptophan
0.323mg
0%
Threonine
1.263mg
0%
Isoleucine
1.035mg
0%
Leucine
2.133mg
0%
Lysine
1.834mg
0%
Methionine
0.646mg
0%
Phenylalanine
1.071mg
0%
Valine
1.263mg
0%
Histidine
0.649mg
0%
Omega-3 - EPA
2.741g
0g
N/A
Omega-3 - DHA
3.8g
0g
N/A
Omega-3 - DPA
0.229g
0g
N/A
Macronutrient Comparison
Macronutrient breakdown side-by-side comparison
2
25%
18%
4%
48%
6%
Protein:
24.6 g
Fats:
17.9 g
Carbs:
4 g
Water:
47.5 g
Other:
6 g
3
18%
22%
44%
8%
8%
Protein:
17.81 g
Fats:
22.27 g
Carbs:
44.24 g
Water:
8.06 g
Other:
7.62 g
Contains
more
Protein Protein
+38.1%
Contains
more
Water Water
+489.3%
Contains
more
Fats Fats
+24.4%
Contains
more
Carbs Carbs
+1006%
Contains
more
Other Other
+27%
Fat Type Comparison
Fat type breakdown side-by-side comparison
1
25%
29%
46%
Saturated fat:
Sat. Fat
4.06 g
Monounsaturated fat:
Mono. Fat
4.631 g
Polyunsaturated fat:
Poly. Fat
7.405 g
2
8%
74%
17%
Saturated fat:
Sat. Fat
1.535 g
Monounsaturated fat:
Mono. Fat
14.04 g
Polyunsaturated fat:
Poly. Fat
3.279 g
Contains
more
Poly. Fat Polyunsaturated fat
+125.8%
Contains
less
Sat. Fat Saturated fat
-62.2%
Contains
more
Mono. Fat Monounsaturated fat
+203.2%