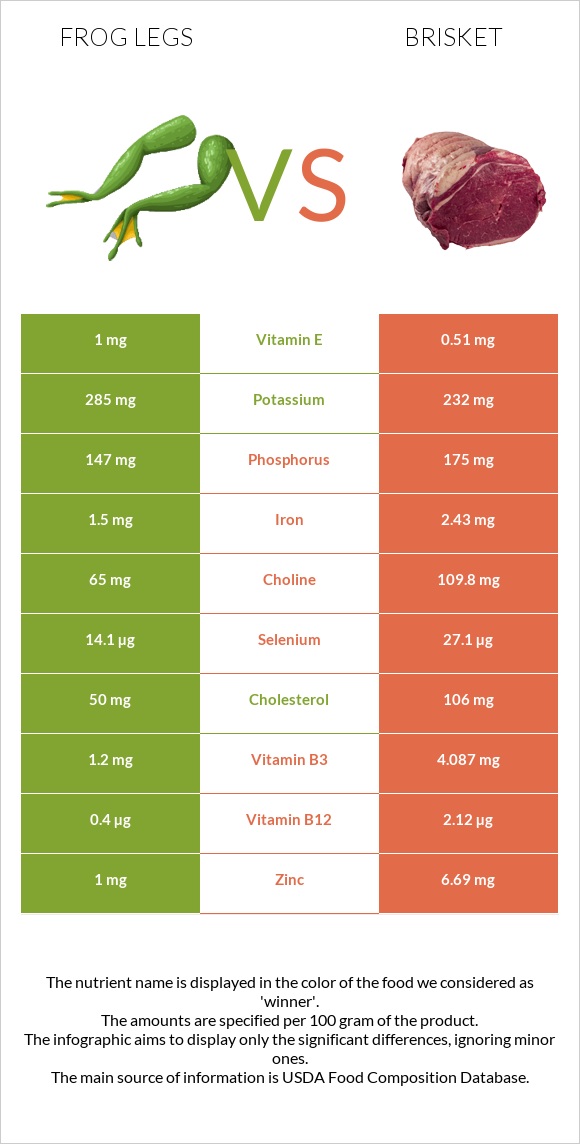
What are the main differences between frog legs and brisket? Frog legs are richer in copper, yet brisket is richer in vitamin B12, zinc, selenium, vitamin B3, vitamin B6, iron, and choline. Brisket's daily need coverage for vitamin B12 is 72% higher. Frog legs have 3 times more copper than brisket. Frog legs have 0.25mg of copper, while brisket has 0.1mg. Frog legs contain less cholesterol. We used Frog legs, raw and Beef, brisket, flat half, separable lean, and fat, trimmed to 1/8" fat, all grades, cooked, braised types in this comparison.
Infographic
Mineral Comparison
Mineral comparison score is based on the number of minerals by which one or the other food is richer. The "coverage" charts below show how much of the daily needs can be covered by 300 grams of the food.
3
100 g
300 g
1 leg - 45g
Magnesium
Magnesium
Calcium
Calcium
Potassium
Potassium
Iron
Iron
Copper
Copper
Zinc
Zinc
Phosphorus
Phosphorus
Sodium
Sodium
Manganese
Manganese
Selenium
Selenium
14%
5.4%
25%
56%
83%
27%
63%
7.6%
0%
77%
6
100 g
300 g
3 oz - 85g 1 steak (yield from raw steak weighing 550 g) - 380g
Magnesium
Magnesium
Calcium
Calcium
Potassium
Potassium
Iron
Iron
Copper
Copper
Zinc
Zinc
Phosphorus
Phosphorus
Sodium
Sodium
Manganese
Manganese
Selenium
Selenium
14%
4.8%
20%
91%
33%
182%
75%
6.3%
1.3%
148%
Vitamin Comparison
Vitamin comparison score is based on the number of vitamins by which one or the other food is richer. The "coverage" charts below show how much of the daily needs can be covered by 300 grams of the food.
6
100 g
300 g
1 leg - 45g
Vitamin C
Vit. C
Vitamin D
Vit. D
Vitamin A
Vit. A
Vitamin E
Vit. E
Vitamin B1
Vit. B1
Vitamin B2
Vit. B2
Vitamin B3
Vit. B3
Vitamin B5
Vit. B5
Vitamin B6
Vit. B6
Vitamin B12
Vit. B12
Vitamin K
Vit. K
Folate
Folate
0%
3%
5%
20%
35%
58%
23%
0%
28%
50%
0.25%
11%
5
100 g
300 g
3 oz - 85g 1 steak (yield from raw steak weighing 550 g) - 380g
Vitamin C
Vit. C
Vitamin D
Vit. D
Vitamin A
Vit. A
Vitamin E
Vit. E
Vitamin B1
Vit. B1
Vitamin B2
Vit. B2
Vitamin B3
Vit. B3
Vitamin B5
Vit. B5
Vitamin B6
Vit. B6
Vitamin B12
Vit. B12
Vitamin K
Vit. K
Folate
Folate
0%
0%
0%
10%
15%
39%
77%
34%
65%
265%
4.5%
6.8%
All nutrients comparison - raw data values
Nutrient
DV% diff.
Vitamin B12
0.4µg
2.12µg
72%
Zinc
1mg
6.69mg
52%
Saturated fat
0.076g
7.305g
33%
Fats
0.3g
18.42g
28%
Protein
16.4g
28.82g
25%
Selenium
14.1µg
27.1µg
24%
Monounsaturated fat
0.053g
7.934g
20%
Cholesterol
50mg
106mg
19%
Vitamin B3
1.2mg
4.087mg
18%
Copper
0.25mg
0.1mg
17%
Iron
1.5mg
2.43mg
12%
Vitamin B6
0.12mg
0.282mg
12%
Calories
73kcal
289kcal
11%
Vitamin B5
0.568mg
11%
Choline
65mg
109.8mg
8%
Vitamin B1
0.14mg
0.059mg
7%
Vitamin B2
0.25mg
0.171mg
6%
Phosphorus
147mg
175mg
4%
Polyunsaturated fat
0.102g
0.681g
4%
Vitamin E
1mg
0.51mg
3%
Potassium
285mg
232mg
2%
Vitamin A
15µg
0µg
2%
Folate
15µg
9µg
2%
Vitamin D*
8 IU
1%
Vitamin D
0.2µg
1%
Vitamin K
0.1µg
1.8µg
1%
Protein per 100 calories
22g
10g
N/A
Calories per 10 g protein
45kcal
100kcal
N/A
Weight per 100 calories
137g
35g
N/A
Unsaturated / Saturated Fat ratio
2
1.2
N/A
Magnesium
20mg
19mg
0%
Calcium
18mg
16mg
0%
Sodium
58mg
48mg
0%
Manganese
0.01mg
0%
Tryptophan
0.181mg
0%
Threonine
1.101mg
0%
Isoleucine
1.253mg
0%
Leucine
2.192mg
0%
Lysine
2.328mg
0%
Methionine
0.717mg
0%
Phenylalanine
1.088mg
0%
Valine
1.367mg
0%
Histidine
0.879mg
0%
Omega-3 - EPA
0.014g
0g
N/A
Omega-3 - DHA
0.02g
0g
N/A
Omega-3 - DPA
0.007g
0g
N/A
Macronutrient Comparison
Macronutrient breakdown side-by-side comparison
2
16%
82%
Protein:
16.4 g
Fats:
0.3 g
Carbs:
0 g
Water:
81.9 g
Other:
1.4 g
2
29%
18%
52%
Protein:
28.82 g
Fats:
18.42 g
Carbs:
0 g
Water:
52.48 g
Other:
0.28 g
Contains
more
Water Water
+56.1%
Contains
more
Other Other
+400%
Contains
more
Protein Protein
+75.7%
Contains
more
Fats Fats
+6040%
Fat Type Comparison
Fat type breakdown side-by-side comparison
1
33%
23%
44%
Saturated fat:
Sat. Fat
0.076 g
Monounsaturated fat:
Mono. Fat
0.053 g
Polyunsaturated fat:
Poly. Fat
0.102 g
2
46%
50%
4%
Saturated fat:
Sat. Fat
7.305 g
Monounsaturated fat:
Mono. Fat
7.934 g
Polyunsaturated fat:
Poly. Fat
0.681 g
Contains
less
Sat. Fat Saturated fat
-99%
Contains
more
Mono. Fat Monounsaturated fat
+14869.8%
Contains
more
Poly. Fat Polyunsaturated fat
+567.6%