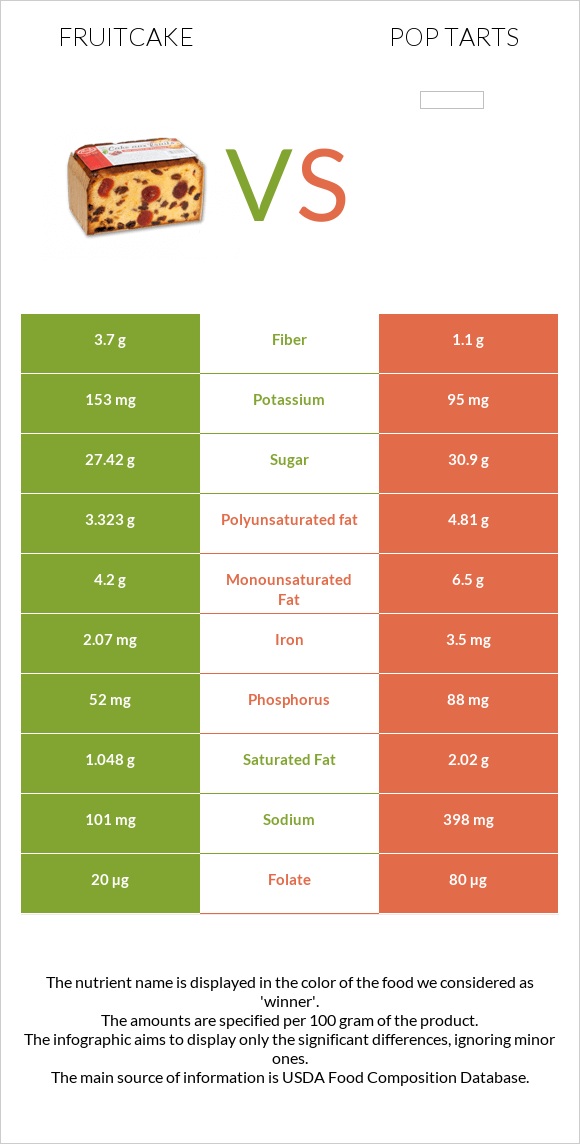
What are the main differences between fruitcake and pop tarts? Fruitcake is richer in fiber, yet pop tarts are richer in vitamin B6, vitamin B1, vitamin B3, vitamin A, iron, vitamin B2, folate, and copper. Pop tarts' daily need coverage for vitamin B6 is 26% higher. Fruitcake has 3 times more fiber than pop tarts. Fruitcake has 3.7g of fiber, while pop tarts have 1.1g. Fruitcake contains less sodium. Fruitcake has a lower glycemic index than pop tarts. We used Cake, fruitcake, commercially prepared and Toaster Pastries, KELLOGG, KELLOGG'S POP TARTS, Blueberry types in this comparison.
Infographic
Mineral Comparison
Mineral comparison score is based on the number of minerals by which one or the other food is richer. The "coverage" charts below show how much of the daily needs can be covered by 300 grams of the food.
5
100 g
300 g
1 oz - 28.35g 1 piece - 43g
Magnesium
Magnesium
Calcium
Calcium
Potassium
Potassium
Iron
Iron
Copper
Copper
Zinc
Zinc
Phosphorus
Phosphorus
Sodium
Sodium
Manganese
Manganese
Selenium
Selenium
11%
9.9%
14%
78%
17%
7.4%
22%
13%
29%
11%
4
100 g
300 g
1 pastry - 52g
Magnesium
Magnesium
Calcium
Calcium
Potassium
Potassium
Iron
Iron
Copper
Copper
Zinc
Zinc
Phosphorus
Phosphorus
Sodium
Sodium
Manganese
Manganese
Selenium
Selenium
11%
7.2%
8.4%
131%
50%
35%
38%
52%
0%
0%
Vitamin Comparison
Vitamin comparison score is based on the number of vitamins by which one or the other food is richer. The "coverage" charts below show how much of the daily needs can be covered by 300 grams of the food.
5
100 g
300 g
1 oz - 28.35g 1 piece - 43g
Vitamin C
Vit. C
Vitamin D
Vit. D
Vitamin A
Vit. A
Vitamin E
Vit. E
Vitamin B1
Vit. B1
Vitamin B2
Vit. B2
Vitamin B3
Vit. B3
Vitamin B5
Vit. B5
Vitamin B6
Vit. B6
Vitamin B12
Vit. B12
Vitamin K
Vit. K
Folate
Folate
1.7%
0%
2.3%
18%
13%
23%
15%
14%
11%
1.3%
3.8%
15%
6
100 g
300 g
1 pastry - 52g
Vitamin C
Vit. C
Vitamin D
Vit. D
Vitamin A
Vit. A
Vitamin E
Vit. E
Vitamin B1
Vit. B1
Vitamin B2
Vit. B2
Vitamin B3
Vit. B3
Vitamin B5
Vit. B5
Vitamin B6
Vit. B6
Vitamin B12
Vit. B12
Vitamin K
Vit. K
Folate
Folate
0%
0%
96%
0%
73%
76%
71%
0%
88%
0%
0%
60%
All nutrients comparison - raw data values
Nutrient
DV% diff.
Vitamin A
7µg
289µg
31%
Vitamin B6
0.046mg
0.38mg
26%
Vitamin B1
0.05mg
0.29mg
20%
Vitamin B3
0.791mg
3.8mg
19%
Iron
2.07mg
3.5mg
18%
Vitamin B2
0.099mg
0.33mg
18%
Folate
20µg
80µg
15%
Sodium
101mg
398mg
13%
Copper
0.05mg
0.15mg
11%
Fiber
3.7g
1.1g
10%
Manganese
0.22mg
10%
Polyunsaturated fat
3.323g
4.81g
10%
Zinc
0.27mg
1.27mg
9%
Fats
9.1g
13.3g
6%
Vitamin E
0.9mg
6%
Monounsaturated fat
4.2g
6.5g
6%
Phosphorus
52mg
88mg
5%
Vitamin B5
0.226mg
0mg
5%
Calories
324kcal
412kcal
4%
Selenium
2µg
4%
Saturated fat
1.048g
2.02g
4%
Protein
2.9g
4.6g
3%
Carbs
61.6g
68.41g
2%
Cholesterol
5mg
0mg
2%
Potassium
153mg
95mg
2%
Choline
8.9mg
2%
Vitamin C
0.5mg
0mg
1%
Calcium
33mg
24mg
1%
Vitamin K
1.5µg
1%
Protein per 100 calories
0.9g
1.1g
N/A
Calories per 10 g protein
1117kcal
896kcal
N/A
Weight per 100 calories
31g
24g
N/A
Unsaturated / Saturated Fat ratio
7.2
5.6
N/A
Net carbs
57.9g
67.31g
N/A
Magnesium
16mg
16mg
0%
Sugar
27.42g
30.9g
N/A
Vitamin B12
0.01µg
0µg
0%
Tryptophan
0.042mg
0%
Threonine
0.102mg
0%
Isoleucine
0.121mg
0%
Leucine
0.206mg
0%
Lysine
0.121mg
0%
Methionine
0.059mg
0%
Phenylalanine
0.14mg
0%
Valine
0.144mg
0%
Histidine
0.071mg
0%
Omega-3 - DHA
0.001g
N/A
Macronutrient Comparison
Macronutrient breakdown side-by-side comparison
1
3%
9%
62%
25%
Protein:
2.9 g
Fats:
9.1 g
Carbs:
61.6 g
Water:
25.3 g
Other:
1.1 g
4
5%
13%
68%
13%
Protein:
4.6 g
Fats:
13.3 g
Carbs:
68.41 g
Water:
12.5 g
Other:
1.19 g
Contains
more
Water Water
+102.4%
Contains
more
Protein Protein
+58.6%
Contains
more
Fats Fats
+46.2%
Contains
more
Carbs Carbs
+11.1%
Fat Type Comparison
Fat type breakdown side-by-side comparison
1
12%
49%
39%
Saturated fat:
Sat. Fat
1.048 g
Monounsaturated fat:
Mono. Fat
4.2 g
Polyunsaturated fat:
Poly. Fat
3.323 g
2
15%
49%
36%
Saturated fat:
Sat. Fat
2.02 g
Monounsaturated fat:
Mono. Fat
6.5 g
Polyunsaturated fat:
Poly. Fat
4.81 g
Contains
less
Sat. Fat Saturated fat
-48.1%
Contains
more
Mono. Fat Monounsaturated fat
+54.8%
Contains
more
Poly. Fat Polyunsaturated fat
+44.7%