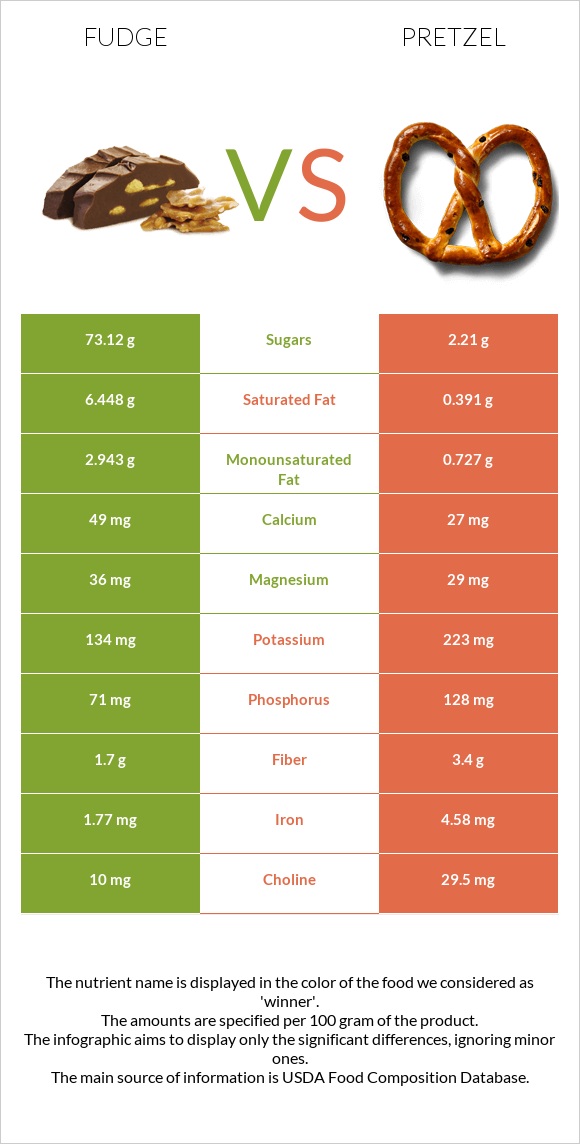
What are the differences between fudge and pretzel? Fudge is higher in copper, yet pretzel is higher in folate, iron, vitamin B1, vitamin B3, manganese, vitamin B2, and phosphorus. Pretzel's daily need coverage for sodium is 52% more. Fudge has 16 times more saturated fat than pretzel. While fudge has 6.448g of saturated fat, pretzel has only 0.391g. The glycemic index of fudge is lower. We used Candies, fudge, chocolate, prepared-from-recipe and Snacks, pretzels, hard, plain, salted types in this article.
Infographic
Mineral Comparison
Mineral comparison score is based on the number of minerals by which one or the other food is richer. The "coverage" charts below show how much of the daily needs can be covered by 300 grams of the food.
4
100 g
300 g
1 piece - 17g
Magnesium
Magnesium
Calcium
Calcium
Potassium
Potassium
Iron
Iron
Copper
Copper
Zinc
Zinc
Phosphorus
Phosphorus
Sodium
Sodium
Manganese
Manganese
Selenium
Selenium
26%
15%
12%
66%
110%
30%
30%
5.9%
55%
14%
5
100 g
300 g
1 oz - 28.35g 10 twists - 60g
Magnesium
Magnesium
Calcium
Calcium
Potassium
Potassium
Iron
Iron
Copper
Copper
Zinc
Zinc
Phosphorus
Phosphorus
Sodium
Sodium
Manganese
Manganese
Selenium
Selenium
21%
8.1%
20%
172%
52%
28%
55%
162%
132%
24%
Vitamin Comparison
Vitamin comparison score is based on the number of vitamins by which one or the other food is richer. The "coverage" charts below show how much of the daily needs can be covered by 300 grams of the food.
2
100 g
300 g
1 piece - 17g
Vitamin C
Vit. C
Vitamin D
Vit. D
Vitamin A
Vit. A
Vitamin E
Vit. E
Vitamin B1
Vit. B1
Vitamin B2
Vit. B2
Vitamin B3
Vit. B3
Vitamin B5
Vit. B5
Vitamin B6
Vit. B6
Vitamin B12
Vit. B12
Vitamin K
Vit. K
Folate
Folate
0%
0%
15%
3.6%
6.5%
20%
3.3%
8.4%
2.8%
11%
3.5%
3%
9
100 g
300 g
1 oz - 28.35g 10 twists - 60g
Vitamin C
Vit. C
Vitamin D
Vit. D
Vitamin A
Vit. A
Vitamin E
Vit. E
Vitamin B1
Vit. B1
Vitamin B2
Vit. B2
Vitamin B3
Vit. B3
Vitamin B5
Vit. B5
Vitamin B6
Vit. B6
Vitamin B12
Vit. B12
Vitamin K
Vit. K
Folate
Folate
7%
0%
0%
9.4%
106%
77%
99%
19%
17%
0%
7%
125%
All nutrients comparison - raw data values
Nutrient
DV% diff.
Sodium
45mg
1240mg
52%
Folate
4µg
166µg
41%
Iron
1.77mg
4.58mg
35%
Vitamin B1
0.026mg
0.424mg
33%
Vitamin B3
0.176mg
5.27mg
32%
Starch
72.58g
30%
Saturated fat
6.448g
0.391g
28%
Manganese
0.422mg
1.015mg
26%
Copper
0.329mg
0.156mg
19%
Vitamin B2
0.085mg
0.332mg
19%
Protein
2.39g
10.04g
15%
Fats
10.41g
2.93g
12%
Phosphorus
71mg
128mg
8%
Fiber
1.7g
3.4g
7%
Monounsaturated fat
2.943g
0.727g
6%
Polyunsaturated fat
0.373g
1.291g
6%
Cholesterol
14mg
0mg
5%
Vitamin A
44µg
0µg
5%
Vitamin B6
0.012mg
0.074mg
5%
Vitamin B5
0.14mg
0.322mg
4%
Vitamin B12
0.09µg
0µg
4%
Choline
10mg
29.5mg
4%
Potassium
134mg
223mg
3%
Selenium
2.5µg
4.4µg
3%
Vitamin C
0mg
2.1mg
2%
Magnesium
36mg
29mg
2%
Calcium
49mg
27mg
2%
Vitamin E
0.18mg
0.47mg
2%
Caffeine
8mg
0mg
2%
Calories
411kcal
384kcal
1%
Carbs
76.44g
80.39g
1%
Zinc
1.11mg
1.04mg
1%
Vitamin K
1.4µg
2.8µg
1%
Protein per 100 calories
0.58g
2.6g
N/A
Calories per 10 g protein
1720kcal
382kcal
N/A
Weight per 100 calories
24g
26g
N/A
Unsaturated / Saturated Fat ratio
0.51
5.2
N/A
Net carbs
74.74g
76.99g
N/A
Sugar
73.12g
2.21g
N/A
Trans fat
0.165g
0.004g
N/A
Tryptophan
0.097mg
0%
Threonine
0.25mg
0%
Isoleucine
0.407mg
0%
Leucine
0.757mg
0%
Lysine
0.257mg
0%
Methionine
0.177mg
0%
Phenylalanine
0.52mg
0%
Valine
0.48mg
0%
Histidine
0.22mg
0%
Fructose
0.31g
0%
Omega-3 - ALA
0.063g
N/A
Omega-6 - Gamma-linoleic acid
0.001g
N/A
Omega-6 - Linoleic acid
1.223g
N/A
Macronutrient Comparison
Macronutrient breakdown side-by-side comparison
2
2%
10%
76%
10%
Protein:
2.39 g
Fats:
10.41 g
Carbs:
76.44 g
Water:
9.81 g
Other:
0.95 g
3
10%
3%
80%
3%
4%
Protein:
10.04 g
Fats:
2.93 g
Carbs:
80.39 g
Water:
3.13 g
Other:
3.51 g
Contains
more
Fats Fats
+255.3%
Contains
more
Water Water
+213.4%
Contains
more
Protein Protein
+320.1%
Contains
more
Other Other
+269.5%
Fat Type Comparison
Fat type breakdown side-by-side comparison
1
66%
30%
4%
Saturated fat:
Sat. Fat
6.448 g
Monounsaturated fat:
Mono. Fat
2.943 g
Polyunsaturated fat:
Poly. Fat
0.373 g
2
16%
30%
54%
Saturated fat:
Sat. Fat
0.391 g
Monounsaturated fat:
Mono. Fat
0.727 g
Polyunsaturated fat:
Poly. Fat
1.291 g
Contains
more
Mono. Fat Monounsaturated fat
+304.8%
Contains
less
Sat. Fat Saturated fat
-93.9%
Contains
more
Poly. Fat Polyunsaturated fat
+246.1%