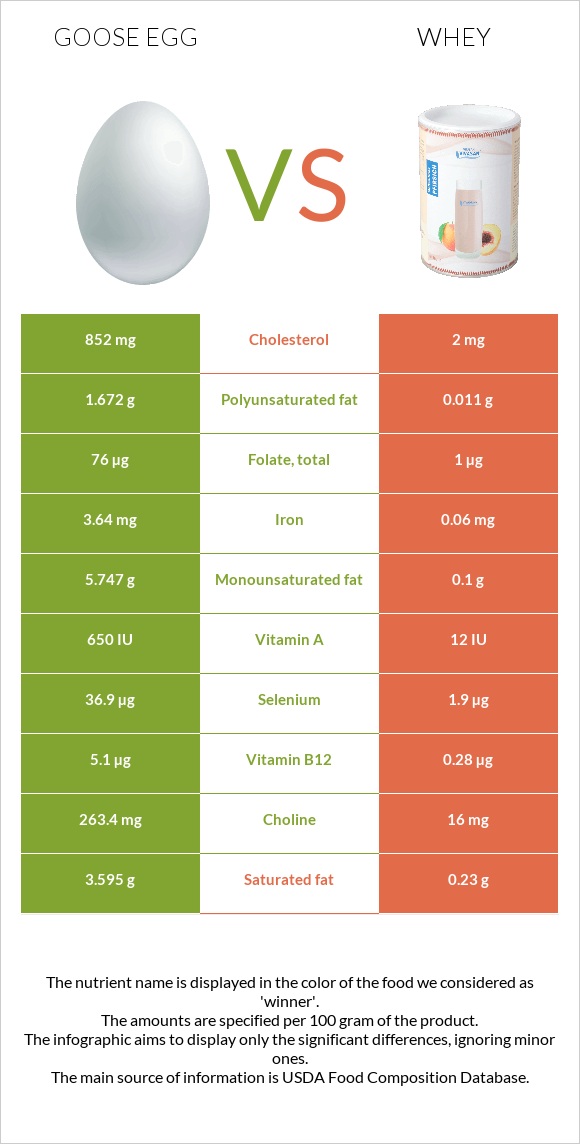
Summary of differences between goose eggs and whey Whey has less vitamin B12, selenium, choline, iron, vitamin B5, phosphorus, folate, and vitamin B2 than goose eggs. Goose eggs cover your daily need for cholesterol, 283% more than whey. Goose eggs have 76 times more folate than whey. While goose eggs have 76µg of folate, whey has only 1µg. Whey has less cholesterol. These are the specific foods used in this comparison Egg, goose, whole, fresh, raw and Whey, sweet, fluid .
Infographic
Mineral Comparison
Mineral comparison score is based on the number of minerals by which one or the other food is richer. The "coverage" charts below show how much of the daily needs can be covered by 300 grams of the food.
9
100 g
300 g
1 egg - 144g
Magnesium
Magnesium
Calcium
Calcium
Potassium
Potassium
Iron
Iron
Copper
Copper
Zinc
Zinc
Phosphorus
Phosphorus
Sodium
Sodium
Manganese
Manganese
Selenium
Selenium
11%
18%
19%
137%
21%
36%
89%
18%
5%
201%
1
100 g
300 g
1 cup - 246g 1 quart - 984g
Magnesium
Magnesium
Calcium
Calcium
Potassium
Potassium
Iron
Iron
Copper
Copper
Zinc
Zinc
Phosphorus
Phosphorus
Sodium
Sodium
Manganese
Manganese
Selenium
Selenium
5.7%
14%
14%
2.3%
1.3%
3.5%
20%
7%
0.13%
10%
Vitamin Comparison
Vitamin comparison score is based on the number of vitamins by which one or the other food is richer. The "coverage" charts below show how much of the daily needs can be covered by 300 grams of the food.
11
100 g
300 g
1 egg - 144g
Vitamin C
Vit. C
Vitamin D
Vit. D
Vitamin A
Vit. A
Vitamin E
Vit. E
Vitamin B1
Vit. B1
Vitamin B2
Vit. B2
Vitamin B3
Vit. B3
Vitamin B5
Vit. B5
Vitamin B6
Vit. B6
Vitamin B12
Vit. B12
Vitamin K
Vit. K
Folate
Folate
0%
26%
62%
26%
37%
88%
3.5%
106%
54%
638%
1%
57%
1
100 g
300 g
1 cup - 246g 1 quart - 984g
Vitamin C
Vit. C
Vitamin D
Vit. D
Vitamin A
Vit. A
Vitamin E
Vit. E
Vitamin B1
Vit. B1
Vitamin B2
Vit. B2
Vitamin B3
Vit. B3
Vitamin B5
Vit. B5
Vitamin B6
Vit. B6
Vitamin B12
Vit. B12
Vitamin K
Vit. K
Folate
Folate
0.33%
0%
1%
0%
9%
36%
1.4%
23%
7.2%
35%
0%
0.75%
All nutrients comparison - raw data values
Nutrient
DV% diff.
Cholesterol
852mg
2mg
283%
Vitamin B12
5.1µg
0.28µg
201%
Selenium
36.9µg
1.9µg
64%
Iron
3.64mg
0.06mg
45%
Choline
263.4mg
16mg
45%
Vitamin B5
1.759mg
0.383mg
28%
Protein
13.87g
0.85g
26%
Phosphorus
208mg
46mg
23%
Fats
13.27g
0.36g
20%
Vitamin A
187µg
3µg
20%
Folate
76µg
1µg
19%
Vitamin B2
0.382mg
0.158mg
17%
Vitamin B6
0.236mg
0.031mg
16%
Saturated fat
3.595g
0.23g
15%
Monounsaturated fat
5.747g
0.1g
14%
Zinc
1.33mg
0.13mg
11%
Polyunsaturated fat
1.672g
0.011g
11%
Vitamin D
1.7µg
9%
Vitamin E
1.29mg
0mg
9%
Vitamin B1
0.147mg
0.036mg
9%
Calories
185kcal
27kcal
8%
Vitamin D*
66 IU
8%
Copper
0.062mg
0.004mg
6%
Sodium
138mg
54mg
4%
Magnesium
16mg
8mg
2%
Manganese
0.038mg
0.001mg
2%
Carbs
1.35g
5.14g
1%
Calcium
60mg
47mg
1%
Potassium
210mg
161mg
1%
Vitamin B3
0.189mg
0.074mg
1%
Protein per 100 calories
7.5g
3.1g
N/A
Calories per 10 g protein
133kcal
318kcal
N/A
Weight per 100 calories
54g
370g
N/A
Unsaturated / Saturated Fat ratio
2.1
0.48
N/A
Vitamin C
0mg
0.1mg
0%
Net carbs
1.35g
5.14g
N/A
Sugar
0.94g
5.14g
N/A
Vitamin K
0.4µg
0µg
0%
Tryptophan
0.282mg
0.013mg
0%
Threonine
0.797mg
0.054mg
0%
Isoleucine
0.647mg
0.047mg
0%
Leucine
1.188mg
0.078mg
0%
Lysine
1.03mg
0.068mg
0%
Methionine
0.624mg
0.016mg
0%
Phenylalanine
0.91mg
0.027mg
0%
Valine
0.958mg
0.046mg
0%
Histidine
0.346mg
0.016mg
0%
Macronutrient Comparison
Macronutrient breakdown side-by-side comparison
3
14%
13%
70%
Protein:
13.87 g
Fats:
13.27 g
Carbs:
1.35 g
Water:
70.43 g
Other:
1.08 g
2
5%
93%
Protein:
0.85 g
Fats:
0.36 g
Carbs:
5.14 g
Water:
93.12 g
Other:
0.53 g
Contains
more
Protein Protein
+1531.8%
Contains
more
Fats Fats
+3586.1%
Contains
more
Other Other
+103.8%
Contains
more
Carbs Carbs
+280.7%
Contains
more
Water Water
+32.2%
Fat Type Comparison
Fat type breakdown side-by-side comparison
2
33%
52%
15%
Saturated fat:
Sat. Fat
3.595 g
Monounsaturated fat:
Mono. Fat
5.747 g
Polyunsaturated fat:
Poly. Fat
1.672 g
1
67%
29%
3%
Saturated fat:
Sat. Fat
0.23 g
Monounsaturated fat:
Mono. Fat
0.1 g
Polyunsaturated fat:
Poly. Fat
0.011 g
Contains
more
Mono. Fat Monounsaturated fat
+5647%
Contains
more
Poly. Fat Polyunsaturated fat
+15100%
Contains
less
Sat. Fat Saturated fat
-93.6%