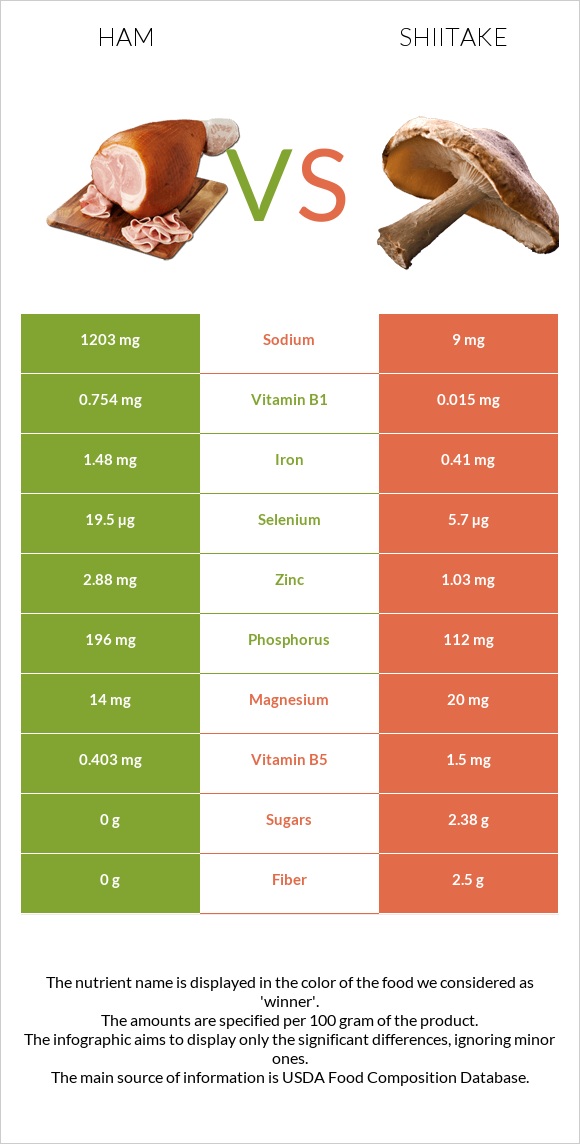
Important differences between ham and shiitake Ham has more vitamin B1, selenium, zinc, iron, phosphorus, and vitamin B6; however, shiitake has more vitamin B5, fiber, and manganese. Ham's daily need coverage for vitamin B1 is 62% more. Ham has 134 times more sodium than shiitake. Ham has 1203mg of sodium, while shiitake has 9mg. Shiitake has a higher glycemic index than ham. The food varieties used in the comparison are Pork, cured, ham, boneless, extra lean (approximately 5% fat), roasted and Mushrooms, shiitake, raw .
Infographic
Mineral Comparison
Mineral comparison score is based on the number of minerals by which one or the other food is richer. The "coverage" charts below show how much of the daily needs can be covered by 300 grams of the food.
5
100 g
300 g
3 oz - 85g 1 cup - 140g
Magnesium
Magnesium
Calcium
Calcium
Potassium
Potassium
Iron
Iron
Copper
Copper
Zinc
Zinc
Phosphorus
Phosphorus
Sodium
Sodium
Manganese
Manganese
Selenium
Selenium
10%
2.4%
25%
56%
26%
79%
84%
157%
7%
106%
4
100 g
300 g
1 piece whole - 19g
Magnesium
Magnesium
Calcium
Calcium
Potassium
Potassium
Iron
Iron
Copper
Copper
Zinc
Zinc
Phosphorus
Phosphorus
Sodium
Sodium
Manganese
Manganese
Selenium
Selenium
14%
0.6%
27%
15%
47%
28%
48%
1.2%
30%
31%
Vitamin Comparison
Vitamin comparison score is based on the number of vitamins by which one or the other food is richer. The "coverage" charts below show how much of the daily needs can be covered by 300 grams of the food.
5
100 g
300 g
3 oz - 85g 1 cup - 140g
Vitamin C
Vit. C
Vitamin D
Vit. D
Vitamin A
Vit. A
Vitamin E
Vit. E
Vitamin B1
Vit. B1
Vitamin B2
Vit. B2
Vitamin B3
Vit. B3
Vitamin B5
Vit. B5
Vitamin B6
Vit. B6
Vitamin B12
Vit. B12
Vitamin K
Vit. K
Folate
Folate
0%
12%
0%
5%
189%
47%
75%
24%
92%
81%
0%
2.3%
2
100 g
300 g
1 piece whole - 19g
Vitamin C
Vit. C
Vitamin D
Vit. D
Vitamin A
Vit. A
Vitamin E
Vit. E
Vitamin B1
Vit. B1
Vitamin B2
Vit. B2
Vitamin B3
Vit. B3
Vitamin B5
Vit. B5
Vitamin B6
Vit. B6
Vitamin B12
Vit. B12
Vitamin K
Vit. K
Folate
Folate
0%
6%
0%
0%
3.8%
50%
73%
90%
68%
0%
0%
9.8%
All nutrients comparison - raw data values
Nutrient
DV% diff.
Vitamin B1
0.754mg
0.015mg
62%
Sodium
1203mg
9mg
52%
Protein
20.93g
2.24g
37%
Vitamin B12
0.65µg
27%
Selenium
19.5µg
5.7µg
25%
Vitamin B5
0.403mg
1.5mg
22%
Cholesterol
53mg
18%
Zinc
2.88mg
1.03mg
17%
Choline
85.1mg
15%
Iron
1.48mg
0.41mg
13%
Phosphorus
196mg
112mg
12%
Fiber
0g
2.5g
10%
Fats
5.53g
0.49g
8%
Manganese
0.054mg
0.23mg
8%
Vitamin B6
0.4mg
0.293mg
8%
Saturated fat
1.81g
8%
Copper
0.079mg
0.142mg
7%
Monounsaturated fat
2.62g
7%
Calories
145kcal
34kcal
6%
Polyunsaturated fat
0.54g
4%
Folate
3µg
13µg
3%
Carbs
1.5g
6.79g
2%
Vitamin D*
32 IU
18 IU
2%
Vitamin D
0.8µg
0.4µg
2%
Vitamin E
0.25mg
2%
Magnesium
14mg
20mg
1%
Calcium
8mg
2mg
1%
Potassium
287mg
304mg
1%
Vitamin B2
0.202mg
0.217mg
1%
Vitamin B3
4.023mg
3.877mg
1%
Protein per 100 calories
14g
6.6g
N/A
Calories per 10 g protein
69kcal
152kcal
N/A
Weight per 100 calories
69g
294g
N/A
Unsaturated / Saturated Fat ratio
1.7
N/A
Net carbs
1.5g
4.29g
N/A
Sugar
0g
2.38g
N/A
Tryptophan
0.251mg
0.011mg
0%
Threonine
0.931mg
0.134mg
0%
Isoleucine
0.918mg
0.111mg
0%
Leucine
1.661mg
0.189mg
0%
Lysine
1.775mg
0.134mg
0%
Methionine
0.553mg
0.033mg
0%
Phenylalanine
0.904mg
0.111mg
0%
Valine
0.908mg
0.145mg
0%
Histidine
0.75mg
0.056mg
0%
Macronutrient Comparison
Macronutrient breakdown side-by-side comparison
3
21%
6%
68%
4%
Protein:
20.93 g
Fats:
5.53 g
Carbs:
1.5 g
Water:
67.67 g
Other:
4.37 g
2
2%
7%
90%
Protein:
2.24 g
Fats:
0.49 g
Carbs:
6.79 g
Water:
89.74 g
Other:
0.74 g
Contains
more
Protein Protein
+834.4%
Contains
more
Fats Fats
+1028.6%
Contains
more
Other Other
+490.5%
Contains
more
Carbs Carbs
+352.7%
Contains
more
Water Water
+32.6%