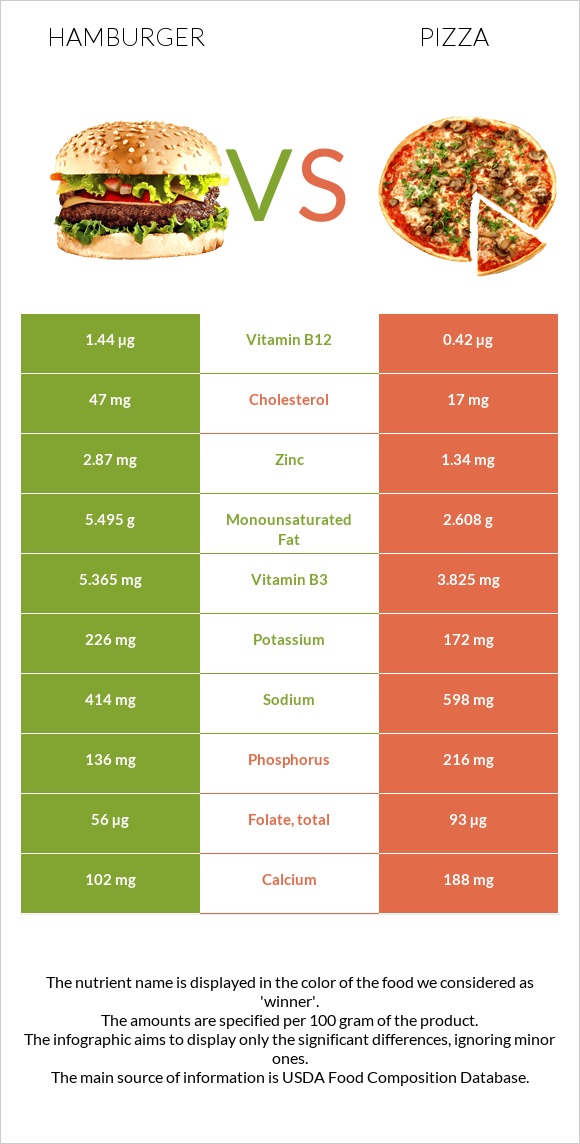
How are hamburgers and pizza different? Hamburgers are higher in vitamin B12, zinc, vitamin B3, and vitamin B6; however, pizza is richer in vitamin B1, phosphorus, folate, and calcium. Daily need coverage for vitamin B12 for hamburgers is 43% higher. Hamburgers contain 3 times more cholesterol than pizza. While hamburgers contain 47mg of cholesterol, pizza contains only 17mg. Fast foods, hamburger; double, regular, patty; plain and Fast Food, Pizza Chain, 14" pizza, cheese topping, regular crust are the varieties used in this article.
Infographic
Mineral Comparison
Mineral comparison score is based on the number of minerals by which one or the other food is richer. The "coverage" charts below show how much of the daily needs can be covered by 300 grams of the food.
4
100 g
300 g
1 item - 120g
Magnesium
Magnesium
Calcium
Calcium
Potassium
Potassium
Iron
Iron
Copper
Copper
Zinc
Zinc
Phosphorus
Phosphorus
Sodium
Sodium
Manganese
Manganese
Selenium
Selenium
14%
31%
20%
108%
30%
78%
58%
54%
28%
0%
6
100 g
300 g
1 slice - 107g 1 pizza - 853g
Magnesium
Magnesium
Calcium
Calcium
Potassium
Potassium
Iron
Iron
Copper
Copper
Zinc
Zinc
Phosphorus
Phosphorus
Sodium
Sodium
Manganese
Manganese
Selenium
Selenium
17%
56%
15%
93%
35%
37%
93%
78%
47%
109%
Vitamin Comparison
Vitamin comparison score is based on the number of vitamins by which one or the other food is richer. The "coverage" charts below show how much of the daily needs can be covered by 300 grams of the food.
5
100 g
300 g
1 item - 120g
Vitamin C
Vit. C
Vitamin D
Vit. D
Vitamin A
Vit. A
Vitamin E
Vit. E
Vitamin B1
Vit. B1
Vitamin B2
Vit. B2
Vitamin B3
Vit. B3
Vitamin B5
Vit. B5
Vitamin B6
Vit. B6
Vitamin B12
Vit. B12
Vitamin K
Vit. K
Folate
Folate
0%
0%
0%
0%
54%
58%
101%
19%
47%
180%
0%
42%
6
100 g
300 g
1 slice - 107g 1 pizza - 853g
Vitamin C
Vit. C
Vitamin D
Vit. D
Vitamin A
Vit. A
Vitamin E
Vit. E
Vitamin B1
Vit. B1
Vitamin B2
Vit. B2
Vitamin B3
Vit. B3
Vitamin B5
Vit. B5
Vitamin B6
Vit. B6
Vitamin B12
Vit. B12
Vitamin K
Vit. K
Folate
Folate
4.7%
0%
23%
17%
98%
45%
72%
0%
18%
53%
17%
70%
All nutrients comparison - raw data values
Nutrient
DV% diff.
Vitamin B12
1.44µg
0.42µg
43%
Selenium
19.9µg
36%
Zinc
2.87mg
1.34mg
14%
Vitamin B1
0.217mg
0.39mg
14%
Protein
17.08g
11.39g
11%
Starch
26.95g
11%
Phosphorus
136mg
216mg
11%
Cholesterol
47mg
17mg
10%
Vitamin B3
5.365mg
3.825mg
10%
Calcium
102mg
188mg
9%
Vitamin B6
0.203mg
0.08mg
9%
Folate
56µg
93µg
9%
Polyunsaturated fat
0.38g
1.681g
9%
Sodium
414mg
598mg
8%
Vitamin A
0µg
69µg
8%
Fats
14.36g
9.69g
7%
Monounsaturated fat
5.495g
2.608g
7%
Fiber
0.9g
2.3g
6%
Vitamin E
0.83mg
6%
Manganese
0.217mg
0.36mg
6%
Vitamin B5
0.31mg
6%
Vitamin K
6.7µg
6%
Iron
2.88mg
2.48mg
5%
Vitamin B2
0.25mg
0.195mg
4%
Carbs
24.1g
33.33g
3%
Choline
16.4mg
3%
Saturated fat
5.096g
4.465g
3%
Vitamin C
0mg
1.4mg
2%
Potassium
226mg
172mg
2%
Copper
0.091mg
0.105mg
2%
Calories
295kcal
266kcal
1%
Magnesium
20mg
24mg
1%
Fructose
2.03g
1g
1%
Protein per 100 calories
5.8g
4.3g
N/A
Calories per 10 g protein
173kcal
234kcal
N/A
Weight per 100 calories
34g
38g
N/A
Unsaturated / Saturated Fat ratio
1.2
0.96
N/A
Net carbs
23.2g
31.03g
N/A
Sugar
4.15g
3.58g
N/A
Trans fat
0.814g
0.241g
N/A
Tryptophan
0.206mg
0%
Threonine
0.666mg
0.41mg
0%
Isoleucine
0.716mg
0.564mg
0%
Leucine
1.319mg
1.139mg
0%
Lysine
1.226mg
0.77mg
0%
Methionine
0.37mg
0.264mg
0%
Phenylalanine
0.677mg
0.664mg
0%
Valine
0.823mg
0.72mg
0%
Histidine
0.505mg
0.355mg
0%
Omega-3 - EPA
0.004g
N/A
Omega-3 - ALA
0.175g
N/A
Omega-3 - DPA
0.004g
N/A
Omega-6 - Gamma-linoleic acid
0.003g
N/A
Omega-6 - Dihomo-gamma-linoleic acid
0.009g
N/A
Omega-6 - Eicosadienoic acid
0.003g
N/A
Omega-6 - Linoleic acid
1.367g
N/A
Macronutrient Comparison
Macronutrient breakdown side-by-side comparison
2
17%
14%
24%
43%
2%
Protein:
17.08 g
Fats:
14.36 g
Carbs:
24.1 g
Water:
42.67 g
Other:
1.79 g
3
11%
10%
33%
43%
2%
Protein:
11.39 g
Fats:
9.69 g
Carbs:
33.33 g
Water:
43.17 g
Other:
2.42 g
Contains
more
Protein Protein
+50%
Contains
more
Fats Fats
+48.2%
Contains
more
Carbs Carbs
+38.3%
Contains
more
Other Other
+35.2%
Fat Type Comparison
Fat type breakdown side-by-side comparison
1
46%
50%
3%
Saturated fat:
Sat. Fat
5.096 g
Monounsaturated fat:
Mono. Fat
5.495 g
Polyunsaturated fat:
Poly. Fat
0.38 g
2
51%
30%
19%
Saturated fat:
Sat. Fat
4.465 g
Monounsaturated fat:
Mono. Fat
2.608 g
Polyunsaturated fat:
Poly. Fat
1.681 g
Contains
more
Mono. Fat Monounsaturated fat
+110.7%
Contains
less
Sat. Fat Saturated fat
-12.4%
Contains
more
Poly. Fat Polyunsaturated fat
+342.4%
Carbohydrate type comparison
Carbohydrate type breakdown side-by-side comparison
3
5%
28%
49%
3%
14%
Starch:
0 g
Sucrose:
0.22 g
Glucose:
1.16 g
Fructose:
2.03 g
Lactose:
0.13 g
Maltose:
0.6 g
Galactose:
0 g
4
88%
3%
3%
3%
Starch:
26.95 g
Sucrose:
0.2 g
Glucose:
0.78 g
Fructose:
1 g
Lactose:
0.42 g
Maltose:
1.05 g
Galactose:
0.13 g
Contains
more
Glucose Glucose
+48.7%
Contains
more
Fructose Fructose
+103%
Contains
more
Starch Starch
+∞%
Contains
more
Lactose Lactose
+223.1%
Contains
more
Maltose Maltose
+75%
Contains
more
Galactose Galactose
+∞%