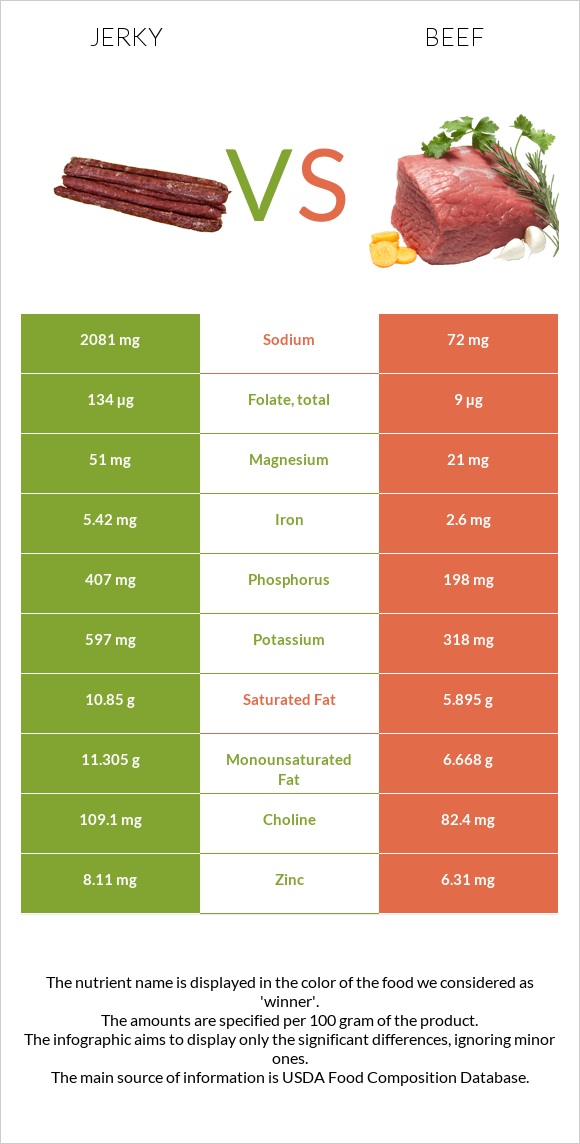
How are jerky and beef different? Jerky is higher in zinc, folate, iron, and phosphorus; however, beef is richer in vitamin B12, vitamin B6, selenium, and vitamin B3. Daily need coverage for vitamin B12 for beef is 134% higher. Jerky contains 39 times more sodium than beef. While jerky contains 2081mg of sodium, beef contains only 54mg. Snacks, beef jerky, chopped, and formed and Beef, loin, tenderloin roast, separable lean only, boneless, trimmed to 0" fat, select, cooked, roasted are the varieties used in this article.
Infographic
Mineral Comparison
Mineral comparison score is based on the number of minerals by which one or the other food is richer. The "coverage" charts below show how much of the daily needs can be covered by 300 grams of the food.
8
100 g
300 g
1 piece, large - 20g 1 oz - 28.35g 1 oz - 28.35g
Magnesium
Magnesium
Calcium
Calcium
Potassium
Potassium
Iron
Iron
Copper
Copper
Zinc
Zinc
Phosphorus
Phosphorus
Sodium
Sodium
Manganese
Manganese
Selenium
Selenium
36%
6%
53%
203%
76%
221%
174%
271%
14%
58%
2
100 g
300 g
3 oz - 85g 1 roast - 487g
Magnesium
Magnesium
Calcium
Calcium
Potassium
Potassium
Iron
Iron
Copper
Copper
Zinc
Zinc
Phosphorus
Phosphorus
Sodium
Sodium
Manganese
Manganese
Selenium
Selenium
10%
3.9%
31%
114%
32%
101%
111%
7%
1.2%
139%
Vitamin Comparison
Vitamin comparison score is based on the number of vitamins by which one or the other food is richer. The "coverage" charts below show how much of the daily needs can be covered by 300 grams of the food.
5
100 g
300 g
1 piece, large - 20g 1 oz - 28.35g 1 oz - 28.35g
Vitamin C
Vit. C
Vitamin D
Vit. D
Vitamin A
Vit. A
Vitamin E
Vit. E
Vitamin B1
Vit. B1
Vitamin B2
Vit. B2
Vitamin B3
Vit. B3
Vitamin B5
Vit. B5
Vitamin B6
Vit. B6
Vitamin B12
Vit. B12
Vitamin K
Vit. K
Folate
Folate
0%
4.5%
0%
9.8%
39%
33%
32%
9.8%
41%
124%
5.8%
101%
6
100 g
300 g
3 oz - 85g 1 roast - 487g
Vitamin C
Vit. C
Vitamin D
Vit. D
Vitamin A
Vit. A
Vitamin E
Vit. E
Vitamin B1
Vit. B1
Vitamin B2
Vit. B2
Vitamin B3
Vit. B3
Vitamin B5
Vit. B5
Vitamin B6
Vit. B6
Vitamin B12
Vit. B12
Vitamin K
Vit. K
Folate
Folate
0%
1.5%
0.67%
5%
19%
92%
108%
29%
154%
526%
4%
5.3%
All nutrients comparison - raw data values
Nutrient
DV% diff.
Vitamin B12
0.99µg
4.21µg
134%
Sodium
2081mg
54mg
88%
Zinc
8.11mg
3.7mg
40%
Vitamin B6
0.179mg
0.669mg
38%
Saturated fat
10.85g
2.595g
38%
Folate
134µg
7µg
32%
Iron
5.42mg
3.04mg
30%
Fats
25.6g
6.54g
29%
Selenium
10.7µg
25.4µg
27%
Vitamin B3
1.732mg
5.76mg
25%
Phosphorus
407mg
259mg
21%
Monounsaturated fat
11.305g
2.734g
21%
Vitamin B2
0.142mg
0.4mg
20%
Copper
0.227mg
0.097mg
14%
Calories
410kcal
169kcal
12%
Cholesterol
48mg
85mg
12%
Protein
33.2g
27.55g
11%
Magnesium
51mg
14mg
9%
Potassium
597mg
352mg
7%
Fiber
1.8g
0g
7%
Vitamin B1
0.154mg
0.074mg
7%
Vitamin B5
0.163mg
0.481mg
6%
Choline
109.1mg
75.6mg
6%
Carbs
11g
0g
4%
Manganese
0.111mg
0.009mg
4%
Polyunsaturated fat
1.011g
0.532g
3%
Vitamin E
0.49mg
0.25mg
2%
Vitamin D*
11 IU
3 IU
1%
Vitamin D
0.3µg
0.1µg
1%
Calcium
20mg
13mg
1%
Vitamin K
2.3µg
1.6µg
1%
Protein per 100 calories
8.1g
16g
N/A
Calories per 10 g protein
123kcal
61kcal
N/A
Weight per 100 calories
24g
59g
N/A
Unsaturated / Saturated Fat ratio
1.1
1.3
N/A
Net carbs
9.2g
0g
N/A
Sugar
9g
0g
N/A
Vitamin A
0µg
2µg
0%
Trans fat
0.375g
N/A
Tryptophan
0.359mg
0%
Threonine
1.534mg
0%
Isoleucine
1.52mg
0%
Leucine
2.833mg
0%
Lysine
3.178mg
0%
Methionine
0.871mg
0%
Phenylalanine
1.299mg
0%
Valine
1.603mg
0%
Histidine
1.244mg
0%
Omega-3 - EPA
0g
0.002g
N/A
Omega-3 - DHA
0g
0.002g
N/A
Omega-3 - ALA
0.013g
N/A
Omega-3 - DPA
0g
0.011g
N/A
Omega-6 - Dihomo-gamma-linoleic acid
0.017g
N/A
Omega-6 - Eicosadienoic acid
0.002g
N/A
Omega-6 - Linoleic acid
0.349g
N/A
Macronutrient Comparison
Macronutrient breakdown side-by-side comparison
4
33%
26%
11%
23%
7%
Protein:
33.2 g
Fats:
25.6 g
Carbs:
11 g
Water:
23.36 g
Other:
6.84 g
1
28%
7%
66%
Protein:
27.55 g
Fats:
6.54 g
Carbs:
0 g
Water:
65.71 g
Other:
0.2 g
Contains
more
Protein Protein
+20.5%
Contains
more
Fats Fats
+291.4%
Contains
more
Carbs Carbs
+∞%
Contains
more
Other Other
+3320%
Contains
more
Water Water
+181.3%
Fat Type Comparison
Fat type breakdown side-by-side comparison
2
47%
49%
4%
Saturated fat:
Sat. Fat
10.85 g
Monounsaturated fat:
Mono. Fat
11.305 g
Polyunsaturated fat:
Poly. Fat
1.011 g
1
44%
47%
9%
Saturated fat:
Sat. Fat
2.595 g
Monounsaturated fat:
Mono. Fat
2.734 g
Polyunsaturated fat:
Poly. Fat
0.532 g
Contains
more
Mono. Fat Monounsaturated fat
+313.5%
Contains
more
Poly. Fat Polyunsaturated fat
+90%
Contains
less
Sat. Fat Saturated fat
-76.1%