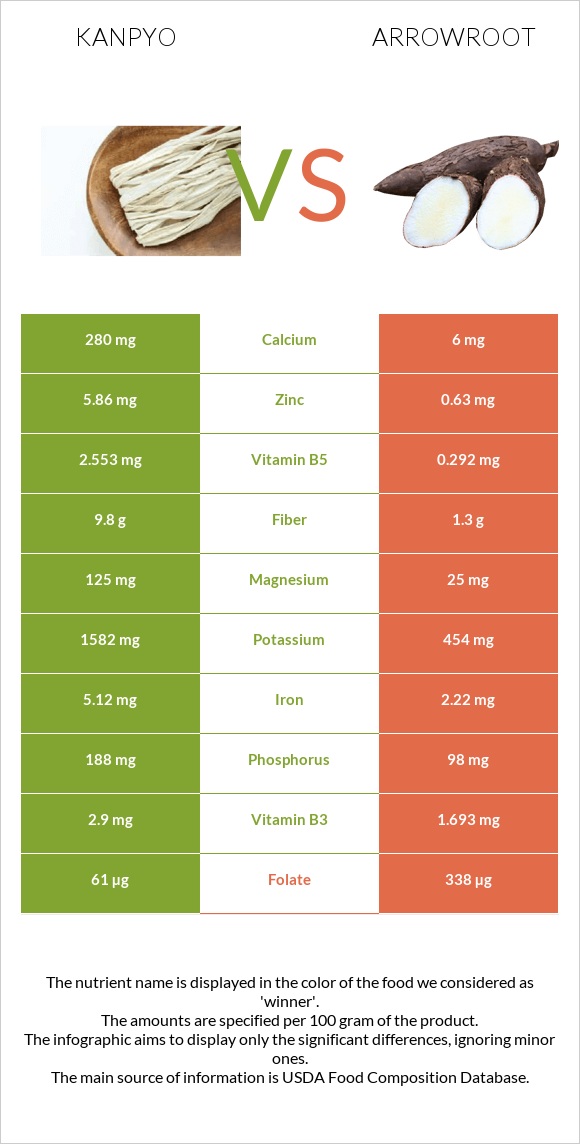
The main differences between kanpyo and arrowroot Kanpyo is richer in zinc, vitamin B5, manganese, iron, copper, fiber, potassium, calcium, and magnesium, yet arrowroot is richer in folate. Daily need coverage for folate for arrowroot is 69% higher. Kanpyo contains 47 times more calcium than arrowroot. Kanpyo contains 280mg of calcium, while arrowroot contains 6mg. Food types used in this article are Kanpyo, (dried gourd strips) and Arrowroot, raw .
Infographic
Mineral Comparison
Mineral comparison score is based on the number of minerals by which one or the other food is richer. The "coverage" charts below show how much of the daily needs can be covered by 300 grams of the food.
10
100 g
300 g
1 strip - 6.3g 0.5 cup - 27g
Magnesium
Magnesium
Calcium
Calcium
Potassium
Potassium
Iron
Iron
Copper
Copper
Zinc
Zinc
Phosphorus
Phosphorus
Sodium
Sodium
Manganese
Manganese
Selenium
Selenium
89%
84%
140%
192%
144%
160%
81%
2%
148%
14%
0
100 g
300 g
1 root - 33g 1 cup, sliced - 120g
Magnesium
Magnesium
Calcium
Calcium
Potassium
Potassium
Iron
Iron
Copper
Copper
Zinc
Zinc
Phosphorus
Phosphorus
Sodium
Sodium
Manganese
Manganese
Selenium
Selenium
18%
1.8%
40%
83%
40%
17%
42%
3.4%
23%
3.8%
Vitamin Comparison
Vitamin comparison score is based on the number of vitamins by which one or the other food is richer. The "coverage" charts below show how much of the daily needs can be covered by 300 grams of the food.
3
100 g
300 g
1 strip - 6.3g 0.5 cup - 27g
Vitamin C
Vit. C
Vitamin D
Vit. D
Vitamin A
Vit. A
Vitamin E
Vit. E
Vitamin B1
Vit. B1
Vitamin B2
Vit. B2
Vitamin B3
Vit. B3
Vitamin B5
Vit. B5
Vitamin B6
Vit. B6
Vitamin B12
Vit. B12
Vitamin K
Vit. K
Folate
Folate
0.67%
0%
0%
0%
0%
10%
54%
153%
123%
0%
0%
46%
5
100 g
300 g
1 root - 33g 1 cup, sliced - 120g
Vitamin C
Vit. C
Vitamin D
Vit. D
Vitamin A
Vit. A
Vitamin E
Vit. E
Vitamin B1
Vit. B1
Vitamin B2
Vit. B2
Vitamin B3
Vit. B3
Vitamin B5
Vit. B5
Vitamin B6
Vit. B6
Vitamin B12
Vit. B12
Vitamin K
Vit. K
Folate
Folate
6.3%
0%
0.33%
0%
36%
14%
32%
18%
61%
0%
0%
254%
All nutrients comparison - raw data values
Nutrient
DV% diff.
Folate
61µg
338µg
69%
Zinc
5.86mg
0.63mg
48%
Vitamin B5
2.553mg
0.292mg
45%
Manganese
1.137mg
0.174mg
42%
Iron
5.12mg
2.22mg
36%
Copper
0.433mg
0.121mg
35%
Fiber
9.8g
1.3g
34%
Potassium
1582mg
454mg
33%
Calcium
280mg
6mg
27%
Magnesium
125mg
25mg
24%
Vitamin B6
0.532mg
0.266mg
20%
Carbs
65.03g
13.39g
17%
Phosphorus
188mg
98mg
13%
Vitamin B1
0mg
0.143mg
12%
Calories
258kcal
65kcal
10%
Protein
8.58g
4.24g
9%
Vitamin B3
2.9mg
1.693mg
8%
Selenium
2.6µg
0.7µg
3%
Vitamin C
0.2mg
1.9mg
2%
Fats
0.56g
0.2g
1%
Vitamin B2
0.044mg
0.059mg
1%
Polyunsaturated fat
0.244g
0.092g
1%
Protein per 100 calories
3.3g
6.5g
N/A
Calories per 10 g protein
301kcal
153kcal
N/A
Weight per 100 calories
39g
154g
N/A
Net carbs
55.23g
12.09g
N/A
Sodium
15mg
26mg
0%
Vitamin A
1µg
0%
Saturated fat
0.045g
0.039g
0%
Monounsaturated fat
0.103g
0.004g
0%
Macronutrient Comparison
Macronutrient breakdown side-by-side comparison
4
9%
65%
20%
6%
Protein:
8.58 g
Fats:
0.56 g
Carbs:
65.03 g
Water:
19.97 g
Other:
5.86 g
1
4%
13%
81%
Protein:
4.24 g
Fats:
0.2 g
Carbs:
13.39 g
Water:
80.75 g
Other:
1.42 g
Contains
more
Protein Protein
+102.4%
Contains
more
Fats Fats
+180%
Contains
more
Carbs Carbs
+385.7%
Contains
more
Other Other
+312.7%
Contains
more
Water Water
+304.4%
Fat Type Comparison
Fat type breakdown side-by-side comparison
2
11%
26%
62%
Saturated fat:
Sat. Fat
0.045 g
Monounsaturated fat:
Mono. Fat
0.103 g
Polyunsaturated fat:
Poly. Fat
0.244 g
1
29%
3%
68%
Saturated fat:
Sat. Fat
0.039 g
Monounsaturated fat:
Mono. Fat
0.004 g
Polyunsaturated fat:
Poly. Fat
0.092 g
Contains
more
Mono. Fat Monounsaturated fat
+2475%
Contains
more
Poly. Fat Polyunsaturated fat
+165.2%
Contains
less
Sat. Fat Saturated fat
-13.3%