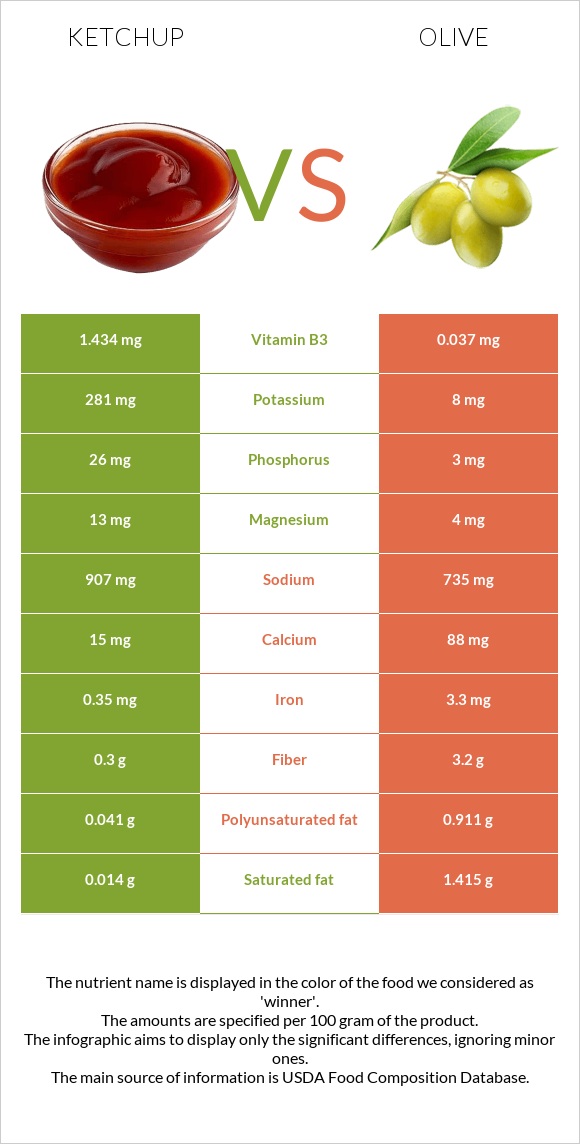
How are ketchup and olive different? Ketchup is richer in vitamin B2, vitamin B6, vitamin B3, and potassium, while olive is higher in iron, copper, fiber, and calcium. Olive covers your daily need for iron, 37% more than ketchup. Olive is lower in sodium. Catsup and Olives, ripe, canned (small-extra large) types were used in this article.
Infographic
Mineral Comparison
Mineral comparison score is based on the number of minerals by which one or the other food is richer. The "coverage" charts below show how much of the daily needs can be covered by 300 grams of the food.
4
100 g
300 g
1 packet - 9g 1 tbsp - 17g 1 cup - 240g
Magnesium
Magnesium
Calcium
Calcium
Potassium
Potassium
Iron
Iron
Copper
Copper
Zinc
Zinc
Phosphorus
Phosphorus
Sodium
Sodium
Manganese
Manganese
Selenium
Selenium
9.3%
4.5%
25%
13%
28%
4.6%
11%
118%
11%
3.8%
6
100 g
300 g
1 small - 3.2g 1 large - 4.4g 1 tbsp - 8.4g
Magnesium
Magnesium
Calcium
Calcium
Potassium
Potassium
Iron
Iron
Copper
Copper
Zinc
Zinc
Phosphorus
Phosphorus
Sodium
Sodium
Manganese
Manganese
Selenium
Selenium
2.9%
26%
0.71%
124%
84%
6%
1.3%
96%
2.6%
4.9%
Vitamin Comparison
Vitamin comparison score is based on the number of vitamins by which one or the other food is richer. The "coverage" charts below show how much of the daily needs can be covered by 300 grams of the food.
9
100 g
300 g
1 packet - 9g 1 tbsp - 17g 1 cup - 240g
Vitamin C
Vit. C
Vitamin D
Vit. D
Vitamin A
Vit. A
Vitamin E
Vit. E
Vitamin B1
Vit. B1
Vitamin B2
Vit. B2
Vitamin B3
Vit. B3
Vitamin B5
Vit. B5
Vitamin B6
Vit. B6
Vitamin B12
Vit. B12
Vitamin K
Vit. K
Folate
Folate
14%
0%
8.7%
29%
2.8%
38%
27%
2.8%
36%
0%
7.5%
6.8%
1
100 g
300 g
1 small - 3.2g 1 large - 4.4g 1 tbsp - 8.4g
Vitamin C
Vit. C
Vitamin D
Vit. D
Vitamin A
Vit. A
Vitamin E
Vit. E
Vitamin B1
Vit. B1
Vitamin B2
Vit. B2
Vitamin B3
Vit. B3
Vitamin B5
Vit. B5
Vitamin B6
Vit. B6
Vitamin B12
Vit. B12
Vitamin K
Vit. K
Folate
Folate
3%
0%
6.7%
33%
0.75%
0%
0.69%
0.9%
2.1%
0%
3.5%
0%
All nutrients comparison - raw data values
Nutrient
DV% diff.
Iron
0.35mg
3.3mg
37%
Monounsaturated fat
0.015g
7.888g
20%
Copper
0.085mg
0.251mg
18%
Fats
0.1g
10.68g
16%
Vitamin B2
0.166mg
0mg
13%
Fiber
0.3g
3.2g
12%
Vitamin B6
0.158mg
0.009mg
11%
Fructose
8.72g
11%
Vitamin B3
1.434mg
0.037mg
9%
Potassium
281mg
8mg
8%
Carbs
27.4g
6.26g
7%
Calcium
15mg
88mg
7%
Sodium
907mg
735mg
7%
Saturated fat
0.014g
1.415g
6%
Polyunsaturated fat
0.041g
0.911g
6%
Vitamin C
4.1mg
0.9mg
4%
Phosphorus
26mg
3mg
3%
Manganese
0.084mg
0.02mg
3%
Magnesium
13mg
4mg
2%
Folate
9µg
0µg
2%
Calories
101kcal
115kcal
1%
Vitamin A
26µg
20µg
1%
Vitamin E
1.46mg
1.65mg
1%
Vitamin B1
0.011mg
0.003mg
1%
Vitamin B5
0.047mg
0.015mg
1%
Vitamin K
3µg
1.4µg
1%
Protein
1.04g
0.84g
0%
Protein per 100 calories
1g
0.73g
N/A
Calories per 10 g protein
971kcal
1369kcal
N/A
Weight per 100 calories
99g
87g
N/A
Unsaturated / Saturated Fat ratio
4
6.2
N/A
Net carbs
27.1g
3.06g
N/A
Sugar
21.27g
0g
N/A
Zinc
0.17mg
0.22mg
0%
Selenium
0.7µg
0.9µg
0%
Choline
12.5mg
10.3mg
0%
Tryptophan
0.005mg
0%
Threonine
0.019mg
0.026mg
0%
Isoleucine
0.014mg
0.031mg
0%
Leucine
0.021mg
0.05mg
0%
Lysine
0.023mg
0.032mg
0%
Methionine
0.005mg
0.012mg
0%
Phenylalanine
0.021mg
0.029mg
0%
Valine
0.014mg
0.038mg
0%
Histidine
0.013mg
0.023mg
0%
Macronutrient Comparison
Macronutrient breakdown side-by-side comparison
3
27%
69%
3%
Protein:
1.04 g
Fats:
0.1 g
Carbs:
27.4 g
Water:
68.51 g
Other:
2.95 g
2
11%
6%
80%
2%
Protein:
0.84 g
Fats:
10.68 g
Carbs:
6.26 g
Water:
79.99 g
Other:
2.23 g
Contains
more
Protein Protein
+23.8%
Contains
more
Carbs Carbs
+337.7%
Contains
more
Other Other
+32.3%
Contains
more
Fats Fats
+10580%
Contains
more
Water Water
+16.8%
Fat Type Comparison
Fat type breakdown side-by-side comparison
1
20%
21%
59%
Saturated fat:
Sat. Fat
0.014 g
Monounsaturated fat:
Mono. Fat
0.015 g
Polyunsaturated fat:
Poly. Fat
0.041 g
2
14%
77%
9%
Saturated fat:
Sat. Fat
1.415 g
Monounsaturated fat:
Mono. Fat
7.888 g
Polyunsaturated fat:
Poly. Fat
0.911 g
Contains
less
Sat. Fat Saturated fat
-99%
Contains
more
Mono. Fat Monounsaturated fat
+52486.7%
Contains
more
Poly. Fat Polyunsaturated fat
+2122%